Statistical physics - a key to understanding of the social and economic complexity
Originally I have written this article back in the end of 2013 and submitted it to a pop-science article contest organized by three locally well-known pop-science blogs "Mokslo sriuba" (en. Science soup; online pop-science web-show), technologijos.lt (en. technology; general science news portal) and konstanta.lt (en. constant; very popular blog dedicated to astronomy and astrophysics). The article was rather successful and won the scientific jury prize in the contest!
Now, after the contest has ended, I can publish this article (and its English translation) on "Physics of Risk". So I invite you to read on!
Imagine - you are currently in the theater. You have just seen a play. While it wasn't that bad, it still wasn't that good. Still somebody have surely enjoyed it! A girl couple of rows below you stood up and started claping (loudly and intensively). What happens next? She looks at a boy sitting near her and says something to him. Whatever she said, it worked like a charm as the boy also stands up and starts clapping (though not so loudly nor intensively). Some people notice the couple and decide that the play wasn't that bad, so they also start claping. People who came with the people already clapping start feeling uncomfortable - are they less profound than their peers? Clearly no, so they also start claping. In few moments time all viewers, and you too, are claping as if the play was truly magnificient! Why? This question I'll attempt to answer by providing you more and diverse examples. But let met start with a brief historical retrospective.
By the middle of XIXth century physicists already knew ideal gas laws. But the laws were known from the experiments, but were not explained theoretically. Theoretical explanation was proposed by James Clerk Maxwell (1831-1879) and Ludwig Eduard Boltzmann (1844-1906), which proposed kinetic theory of gasses. At the core of this theory was cutting-edge novelty in physics - a simple idea that individual trajectories of each particle does not matter and that the only important thing is common properties of their collisions. These commonalities were described and taken into account by using statistics framework, which was started to develop in the works by the pioneers of sociology, such as Adolphe Quetelet (1796-1874), Auguste Comte (1798-1857) and John Stuart Mill (1806-1873). In sociology this framework was used to described common properties of human societies. This is well reflected by Boltzmann, who noted that "molecules are like so many individuals, having the most various states of motion" while formulating the founding principles of statistical mechanics.
In order to be able to use statistical framework to its full extent one needs to have large amounts of data. The collection of economic and social data in XIXth century was quite problematic as the experiments with humans were practically impossible and there was no way to conveniently and reliably collect and store high-resolution real-world data. So the social scientists had to adapt their way of "doing" science - they had to rely more on the general ideas than on the data. In this context an image of rational, with only notably rare exceptions, society (economy, market, etc.) was developed. Interestingly enough despite intense critique by the social scientists themselves this image is still alive and kicking today.
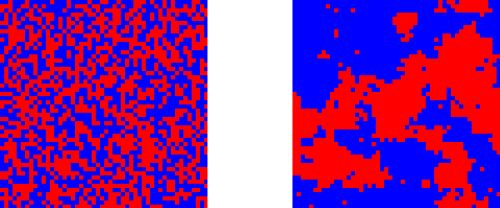
Physicists on the other hand were able to conduct experiments as much as they needed, and thus statistical physics marched at the full speed ahead. Soon after the development of the kinetic theory, it was used by Albert Einstein and Marian Smoluchowski (1872-1917) to prove the existence of atoms. A few decades latter Ernst Ising (1900-1998) proposed an elementary model to explain ferromagnetism. Ising model is especially interesting due to exhibiting emergence of orderly structures. Furthermore by the middle of XX-th century physicists started to notice other inanimate systems, which exhibited emergence of orderly structure. These structures were something very fascinating, because they were found to emerge from the interactions between the particles rather than being an intrinsic part of the particles themselves.
 Fig 1.Emergence of orderly structure in the Ising model. On the left we show initial disorder, while on the write we see how the same spin domains (structures) are forming. Here distinct colors represent particles with magnetic spins pointing up or down. Illustration obtained by using applet available on
An excellent example of the spontaneous emergence of structures is the Belousov-Zhabotinsky reaction. Chemical reagents are added to the medium in which they mix and react. In further reactions participate not only the initial reagents, but also the products of previous reactions. As the reagents may have different colorings, the color of the medium also changes in time and space.
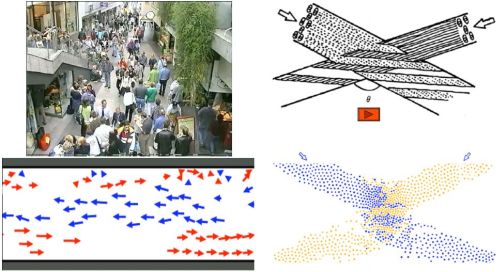
Similar patterns and phenomena may be observed in living systems. For example each autumn we can observe birds flocking together and going south. Then the flock is moving it appears that each separate individual is moving erratically, but while flock stays united and is able to fly in a definite direction. Social patterns may be observed all year round - one just needs to find a popular pedestrian alley or square. People movement on an individual scale will be inherently erratic, but people on a global scale will form lanes and move in structured manner.
 Fig 2.Two examples of emerging social structures: pedestrian alley and intersecting pedestrian flows. Both illustrations taken from prof. dr. D. Helbing talk 'Pedestrians, Crowds, Disasters, and the Role of Self-Organization.'
In the illustration above you can see two examples. On the left - photo of pedestrian alley and a diagram of people movement directions. Note that people moving in the same direction frequently form groups. In this way "traffic lanes" spontaneously emerge. Second example is on the right and here we see two intersecting pedestrian flows. The top figure shows theoretical prediction, while the bottom - result obtained in numerical simulation. Similar patterns may be observed in the most busy and complex road crossings, which also have diagonal lanes (such road crossings may be found in the largest cities - Tokyo, London, New York, etc.).
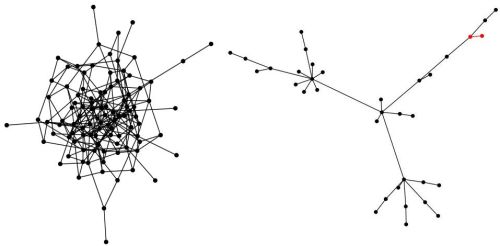
Structures also form as a result of our social life. In previous century it was noted that social interactions may be visualized as graph. Graph - is a mathematical object, which is composed of nodes (dots in the figure below), in social context - individuals, and edges (lines in the figure below), in social context - existing social relationship (e.g., family ties, friendship, being acquaintances or co-workers). Social graphs are frequently referred to as social networks or simply networks. Thus in science this term appeared earlier than Facebook, Google+ or other social networking websites were created. Though contemporary scientists frequently use the data from these websites in their contemporary research.
 Fig 3.Two networks: left one was generated by using Erdos-Renyi algorithm, right one was generated by using Barabasi-Albert algorithm. Illustration was obtained by using applets from other articles on Physics of Risk.
In the figure above you can see two distinct networks. Network on the left was generated by assuming that social interactions (represented by the edges) between individuals (nodes) form randomly. In such network most nodes have similar number of edges connected to them (node degree). In contrast, nodes of network on the right have very broad distribution of degrees - there are relatively many nodes with small degree and also relatively many nodes with large degree. Similar patterns are observed in actual social networks - there are many people who are comparatively socially inactive, while there also unbelievably many individuals who are very socially active.
Social structures emerge not only in the spatial dimension, but also in time domain. E.g., in the financial markets periods large trading activity (price variation) are followed by the periods low trading activity. Similar dynamics was observed, while registering internet traffic flow, number of emails sent from the server, number of sms sent and calls made in the mobile operator networks and also appearance of messages Twitter. Classical theories from social sciences tend to related these observations to the external information flows. But let us recall previous examples - does some policeman regulate traffic in the pedestrian alley? Does somebody force you to select one friends over the others? Does somebody "color" the Belousov-Zhabotinsky reaction? No. Thus external information, or more generally external influence, is not necessary for social structures to emerge - structures may be formed simply due to intrinsic social interactions.
Same phenomenon is also behind the events in theater, which we discussed in the opening paragraph. Human interactions made the mediocre play into a hit.
The aim of this article was to review variety of emerging social structures and also to show that essentially similar phenomena are observed both in the living and inanimate complex systems. Contemporary understanding of inanimate complex is already well developed. These ideas may be further used to gain insights into the living complex systems. Due to stochastic nature of socio-economic systems, ideas from the statistical physics become of utmost importance. As the most of the interesting questions in the field are asked about economics, one just has to invent term "econophysics" as a sum of economics and physics.
