Price formation: printing press example
Couple of months ago I have started a series of posts on price formation in the free market or how and why the free market does (not) work.
In the first part of the series we have discussed economic laws of supply and demand. We have also mentioned the "sweet spot" of the supply-demand model - equilibrium price. But we did not cover how one would discover the equilibrium price.
What I did not notice previously, until revisiting the topic while writing this post, is that the supply and demand laws should be stated as areas and not curves. The simple logic is that if you sell, you are keen to sell at no lower than some price. You will be obviously happy to sell at higher price. Hence for the supplier any point on or above supply curve is desirable outcome. The same logic applies to the demand curve - buyers are happy to buy at some price or lower.
Printing press example
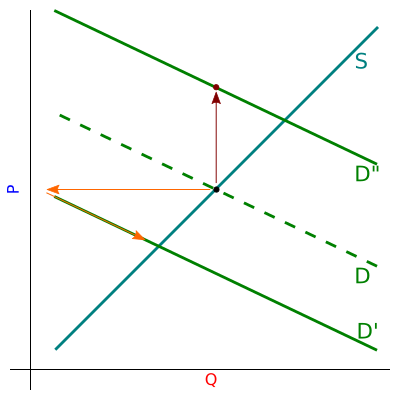
To continue the discussion, let us take a simple example, which will illustrate this logic. Let us assume that a printing press wants to publish a book. Printing press is perfectly aware of its own supply law (because they know how much materials and labor as well as their alternative costs), which describes their worst-case intent to sell. Their supply law is given in a figure below by blue-ish curve with label S.
 Fig 1.The illustration of the printing press example using supply and demand laws. Notation is explained in the text and previous posts.
After conducting market research, they determine the worst-case intent to buy - the demand curve of the potential buyers (green dashed curve with label D). From the laws they know they determine the equilibrium price and quantity (black dot), which they will produce and try to sell at.
Now let us assume that the market research forecast was wrong, namely, that there is excess supply (green curve with label D') or excess demand (green curve with label D").
If there is excess demand (D" case), then the solution seems simple - just raise the price until the quantity demanded decreases to a point where it equals the quantity supplied. Note that it would be optimal to move along S curve, but this is possible only if producing additional copies of book does not require much effort. Of course if a new optimal quantity is significantly larger than old optimal quantity, then it would be possible to print another edition and sell more units at a larger price. But if the difference is not significant enough, then it would not be economically reasonable to produce more books. The exact decision would depend on the actual curves and numbers.
In the figure we have assumed that it is unreasonable to print more books. Hence the brown arrow points upward - the printed books are sold at a new higher price.
If there is excess supply (D' case), then the situation is trickier. Most likely it would be reasonable to sell as much books as possible at the planned price and then offer various discounts in order to avoid a bigger loss. The price trajectory would be approximately indicated by orange arrows. Note that as the copies are sold D' would move, even if the movement is significant, the optimal price is still on the demand curve.
Note that in all covered cases the price is not optimal. It hurts either the producer or the customer. One would need to assume that errors in favor of one or the other are equally probable, to obtain the conclusion that on average neither gains unfair advantage. But "on average" is rather bad concept - if your one feet is in icy water, and the other is in extremely hot water... In this case you are not OK, even if the average suggests that you should be. To obtain the optimal outcome one would need to have a perfect knowledge of supply and demand laws as well as prefect competition (to keep the supply curve down), which is nearly impossible in practice.
