Laws of Supply and Demand
At the heart of economics lies two fundamental concepts, to which most of the other concepts are related. These two concepts are supply and demand. From every day life we are rather familiar with these two concepts - we demand goods and services, while industry supplies them. While industry demands labor and we supply it. But this familiarity to most of us is rather superficial, thus in this text we will try to provide a simple academical introduction into these concepts and their role in economics.
It is intended that this text will serve as an introduction into a series of posts on how and why free market does (not) work.
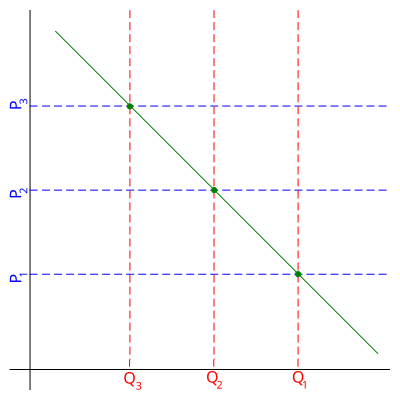
Let us start by discussing the law of demand. This law of economics states that the pricier the product is (all other things being equal) the less people will be willing to buy it. This seems rather reasonable, because if the only difference is price, then it would be rational to choose cheaper product. In the figure below we have shown a linear demand curve, from the graph it can be easily inferred that the priciest product is the least demanded, while the cheapest is the most demanded. In general the demand curve could be any non-increasing function, e.g., \( P \propto 1/Q \).
 Fig. 1:Law of demand. Here P stands for price and Q for quantity.
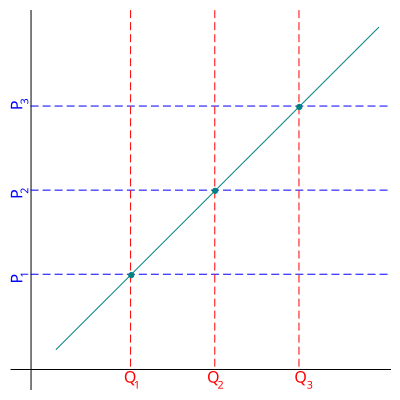
Evidently the law of supply is of the opposite form. This law of economics states that the more people are willing to pay for the product, the larger quantity of the product will be produced (as the producer will try to maximize his gains). In the figure below we have shown a linear supply curve, from the graph it is easy to infer that the larger the price paid for the product, the more of it will be produced. In general the supply curve could by any non-decreasing curve, e.g, \( Q \propto \sqrt{P} \).
 Fig. 2:Law of supply. Here P stands for price and Q for quantity.
Note that in both figures pairs of \( Q \) and \( P \) represent points on the respective curves. If point \( (P_i,Q_i) \) is not on the curve, then either production or consumption is sub-optimal.
Here, while looking for optimal pair of \( (P_i,Q_i) \) the dynamics emerge. But at first one needs to combine two laws into one model. Because then providing supply one must to take demand into account, if some producer decides to produce 100 units of certain product, there might not be enough people willing to buy it for the set price. The belief in these dynamics is the basis for the free market ideology, which claims that markets will eventually find "optimal" price without any interference from the outside.
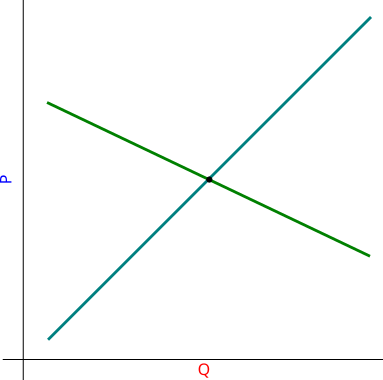
We will discuss the dynamics next time. This time let us finish with an obvious reveal - the optimal point is where both supply and demand curves intersect. As this point is the only point at which both sides are satisfied.
 Fig. 3:Optimal point is at the intersection of the supply and demand curves. Here P stands for price and Q for quantity.
Note (written on 2017-12-19): After revisiting the topic I have noticed a rather obvious thing - why the laws are stated as curves? They should be stated as areas. Because you would buy the item if it costs as much as you imagine it is worth or cheaper (a point below the demand curve). Also you would be willing to sell item at some reasonable price or at larger price (a point above the supply curve). In case of supply law a reasonable explanation is competition - you can not raise price too much as your competitors would have chance to steal your customers.
