FIFA World Cup 2022 predictions
Few years ago I have played around with Premier League data and created a simple model of EPL 2000/2001 season. Let us put it to the test and predict upcoming FIFA World Cup in 2022?
Note that my predictions here should not be treated as a betting advice. It is just a quick fun exercise for me.
The model
The core of the model remains as it was discussed few years ago, but some important changes must be made, because of the nature of FIFA World Cup and the available data.
To make predictions, I am using international match data compiled by Brenda_L and made publicly available on Kaggle. This data set includes all international football matches from 1993 to 2022, but I am making use only of current FIFA World Cup qualification data (games played from 2019) and FIFA World Cup match data from 2002.
Qualification data is used to estimate scoring propensity of each team, as well as their defensive capabilities. Scoring propensity is just the average number of goals scored per qualification match. Estimation of the defensive capability is a bit more involved: it is equal to the ratio of the average number of conceded goals by the team and the average number of conceded goals by all teams in the same continent.
For example, England has scored 39 goals in 10 matches. Its scoring propensity is \( 3.9 \). They have conceded 3 goals in 10 matches. While European teams have conceded \( 1.51 \) goals on average. Their defensive capability modifier is around \( 0.199 \) (\( = 0.3 / 1.51 \)).
Note that I have ignored the distinction between home and away games. These should not matter in the World Cup.
Earlier World Cup data is used to fill in the knowledge gap when teams from different continents play against each other. Qualification games are played only against teams from the same continent, while World Cup games are played more often against team from another continent. Earlier World Cup data is used to estimate the strength of different continental confederations. I have decided to use data from 2002, because data just from 2018 was not enough (too few games between South and North American teams).
When playing a match between any two teams, their goal scoring propensity is multiplied by the opponents defensive capability modifier and by the square root of the continent modifier. The continent modifier depends on the origin continents of both playing teams.
For example, if France plays Australia, then the continent modifiers of Europe against Asia and Asia against Europe is calculated. Historically European teams have scored \( 2.52 \) times more goals than Asian teams. Therefore France's goal scoring propensity is multiplied by \( 1.58 \) and Australia's goal scoring propensity is multiplied by \( 0.63 \).
This is it for the model of a single match. All that remains is to build the tournament! And to simulate!
The overall prediction
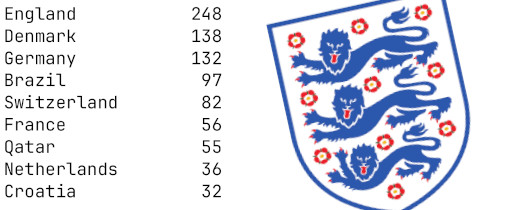
The code used to make the prediction can be found on GitHub. The detailed prediction is also visible there. It is... England! Well, roughly in quarter of simulated World Cups.
More details in video below :)
