Kolmogorov-Smirnov test
Last time we have explored the distribution of increments obtained from the interpolated Brownian motion. We have seen that the correct interpolation formula generates proper increments. Yet we have seen that with just our eyes. While the eyes are a good tool, they sometimes can lie. Thus it is wise to use a formal method to verify our intuition.
Here in this post we will discuss one of the simplest methods to verify whether data follows certain distribution - Kolmogorov-Smirnov test.
K-S test
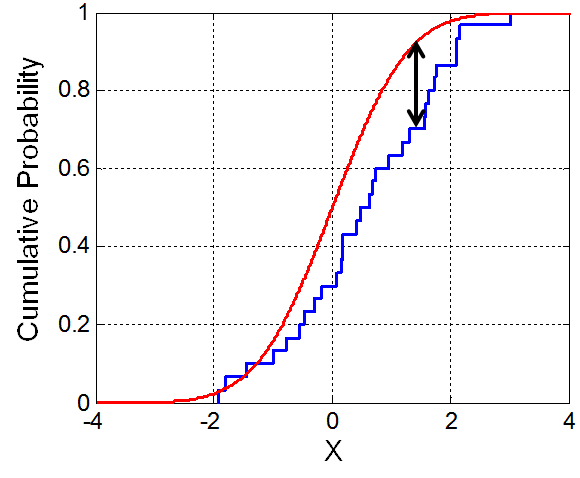
Kolmogorov-Smirnov test is based on the comparison of empirical CDF and theoretical CDF. If the maximum difference between those CDFs is smaller than certain threshold, then there is not enough evidence to reject hypothesis that data does not follow the selected theoretical distribution. In the absence of such evidence, we can reasonably conclude that data does follow the distribution.
So we obtain the K-S static:
\begin{equation} D = \max_x \left| P_{emp}(x) - P_{teor}(x) \right| . \end{equation}
And check whether it smaller than critical threshold. Critical threshold will differ depending on the significance level you want to reach. Often in the social sciences 5% level is used. For this level critical value is equal to:
\begin{equation} C = \frac{1.36}{\sqrt{N}} . \end{equation}
In the above \( N \) is the number of empirical data points. In our case \( N = 256 \), thus \( C = 0.085 \).
 Fig. 1:Visual illustration of K-S test in action.
Interactive app
This app is almost exactly the same as the app from the previous post. The difference is that after the trajectory is generated and differentiated, empirical CDF of the increments is plotted (instead of PDF). In the bottom right of the app frame you will also see a green or red text, which indicates the obtained K-S static (\( D \)) and the threshold value (which is always \( 0.085 \) in the app).
Everything seems fine doesn't it?
