Exploring parking strategies with nonhomogeneous inflow
Last time we have looked at how four different parking strategies work when inflow of drivers is homogeneous. We have done similarly to what was done in [1, 2], though our angle was a bit different.
This time we have modified the approach further. Namely, now we allow you to randomize the inflow of drivers and explore how do the performance of these strategies change in nonhomogeneous society.
Different costs
We will explore the effects of different costs by allowing all four strategies to be equally common. Then, if walking is preferred to driving, obviously, meek strategy (dark gray cruve) is the best. In fact it performs even better when parking lot becomes filled.
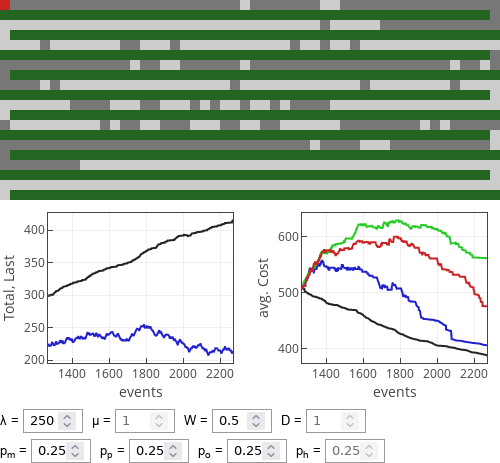 Fig. 1:Performance of strategies when walking is cheaper than driving.
When walking becomes more costly (likely because it takes more time), then 1/2 rule (red curve) and optimist (green curve) strategies become better than the meek strategy. Yet optimist strategy doesn't become best as soon as \( W > D \). If \( W \) is only slightly bigger than \( D \), then 1/2 rule seems to perform slightly better.
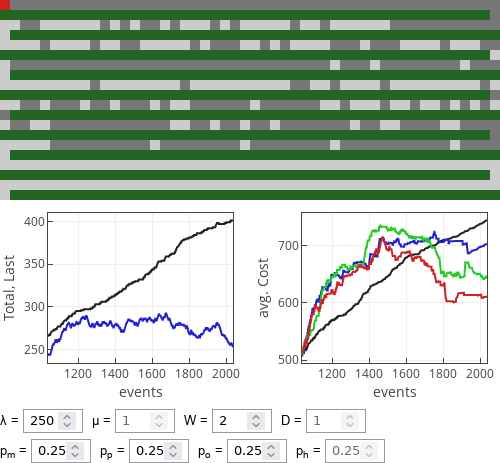 Fig. 2:Performance of strategies when walking is slightly more costly than driving.
Though for \( W \gg D \) optimist strategy yields lowest cost. This is natural as in this case walking is penalized a lot more than a little bit extra driving.
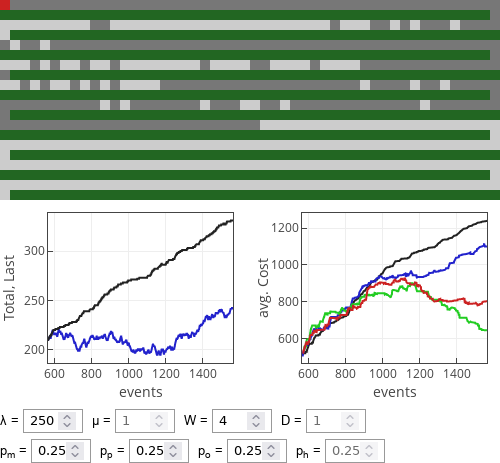 Fig. 3:Performance of strategies when walking is noticeably more costly than driving.
Different popular strategies
Let us now explore scenario in which one strategy is used by \( 70\% \) drivers. For this particular case we will keep costs fixed at \( W=4 \) and \( D=1 \).
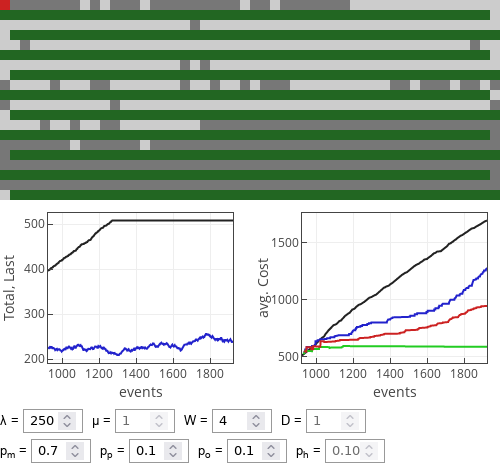 Fig. 4:If meek drivers dominate then optimist strategy works extremely well.
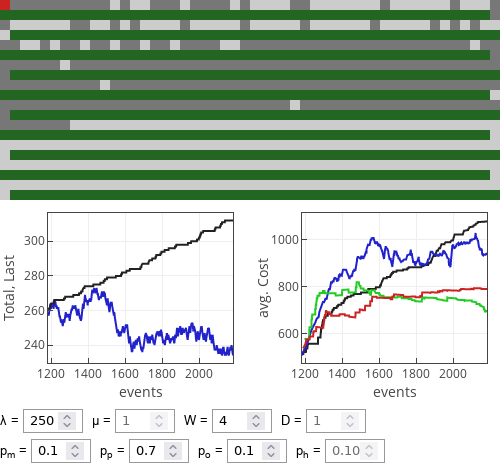 Fig. 5:If prudent drivers dominate then optimist strategy works reasonably well, 1/2 rule drivers also do rather well.
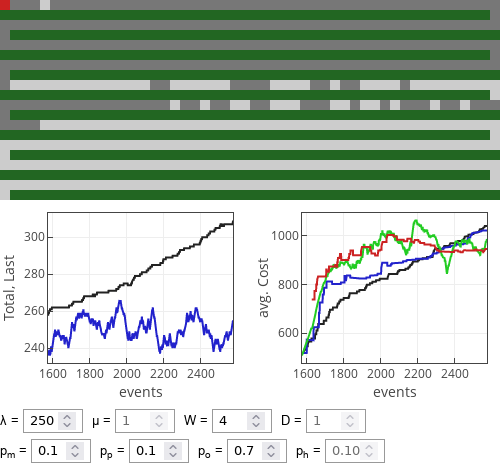 Fig. 6:If optimist drivers dominate then all strategies perform similarly well.
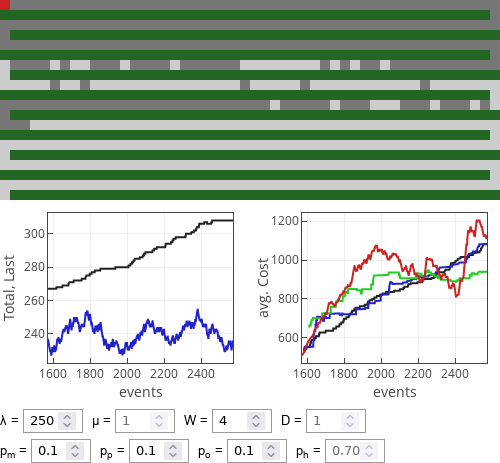 Fig. 7:If 1/2 rule followers dominate then all strategies perform similarly well, though optimists seem to do somewhat better.
Strangely, in neither case prudent driving strategy seems to work as good as the others. If the parking lot is rather empty, then often it performs less well than even the meek strategy.
Interactive app
This app is very much alike the one from the last post. Besides the already addressed difference in that now you can have drivers following different strategies, another difference is that now we plot average cost without normalization. This is because the average cost for each strategy is calculated over the last \( 50 \) drivers using that strategy.
There are other variables and scenarios we haven't considered. For example what is the effect of \( \lambda \)? Feel free to explore it on your own, and drop us a comment if you feel like it.
References
- P. L. Krapivsky, S. Redner. Simple parking strategies. Journal of Statistical Mechanics 2019: 093404 (2019). arXiv:1904.06612v2 [physics.soc-ph]. doi: 10.1088/1742-5468/ab3a2a.
- P. L. Krapivsky, S. Redner. Where should you park your car? The 1/2 rule. Journal of Statistical Mechanics 2020: 073404 (2020). arXiv:2003.10603 [physics.soc-ph]. doi: 10.1088/1742-5468/ab96b7.
