Herd immunity
Recently a new movement made its way to Lithuania - anti-vaccine movement. Some parents after reading few texts online become convinced that vaccines are actually dangerous to health of their children. Thus they decide no to vaccinate their children. A brief reading online somehow trumps centuries of scientific progress in Medicine.
While we here at Physics of Risk usually write about economical and social systems, but the tools we use may be as effectively used to understand the spreading of diseases. Contemporary scientific literature usually uses network theory to find optimal vaccination strategies, but we will not delve in this complex matter. Our aim in this text is to show that vaccination helps saving lives of millions of people. Thus we may use a simpler agent-based model for this.
Formulation of the model
First of all let us note that agents may be either vaccinated (in the app below they will be shown in green) or unvaccinated (shown in blue). The probability that individual agent will be vaccinated is one of the parameters of the model \( p_{vac} \). App below asks for two values of this parameter. One of them is used for the left population of agents, while the second one is used for the right population of agents. These agent populations "live" on separate square grids, opposing ends of which are connected (right-to-left, top-to-bottom).
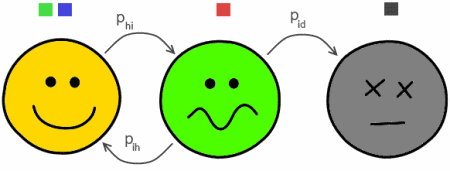
Each of the agents may be healthy (the coloring then represents its vaccination status), infected (shown in red) and dead (show in black). The agents transition between these states according to simple transition probabilities per unit of time. Healthy agent might get infected by single other infected agent with probability \( p_{hi} \) (each agent has 4 neighbors, has some natural immunity and may be vaccinated, thus actual infection probability is more complex (see below)), infected agent might become healthy again, \( p_{ih} \), or die, \( p_{id} \).
 Fig. 1:Simplified scheme of the model
During each time tick (we assume that it is fixed and equal to 1) each agent interacts with 4 of his nearest neighbors. Thus each of his infected neighbors might infect him. Let us assume that \( n_{j,i} \) of agents \( j \) neighbors are infected. Then the probability that agent will not get infected from any of them equals:
\begin{equation} p_{j,hh} = (1-p_{hi})^{n_{j,i}} . \end{equation}
Probability of the opposite event, that agent will get infected, is given by:
\begin{equation} {\tilde p}_{j,hi} = 1 - p_{j,hh} = 1 -(1-p_{hi})^{n_{j,i}} . \end{equation}
Lets say that \( p_{im} \) describes the probability of avoiding infection due to natural immunity. Then the probability to become infected has the following form:
\begin{equation} p_{j,hi} = (1 - p_{im}) {\tilde p}_{j,hi} = (1 - p_{im}) [1 - (1-p_{hi})^{n_{j,i}} ] . \end{equation}
Vaccinated agents are further protected. Let us say that \( p_{eff} \) describes the probability of avoiding infection due to vaccination. Then the probability to become infected has the following form:
\begin{equation} p_{j,v,hi} = (1-p_{eff}) p_{j,hi} = (1-p_{eff}) (1 -p_{im}) [1 - (1-p_{hi})^{n_{j,i}}] . \end{equation}
From the comparison between \( p_{j,hi} \) and \( p_{j,v,hi} \) should evident that \( p_{j,hi} \geq p_{j,v,hi} \) (the probability of getting infected is larger for the unvaccinated agents). This is true as due to the definition of probability, \( 0\leq p \leq 1 \), the inequality \( 1 \geq 1 - p_{eff} \) is always satisfied. There two edge cases in which vaccination does not matter - ineffective vaccine, \( p_{eff} = 0 \), and ideal immunity, \( p_{im} = 1 \). It is rather obvious that vaccines are rigorously tested thus their are at least a bit effective (thus \( 0 < p_{eff} \)), furthermore no single individual has an ideal immunity (inborn or obtained), thus \( p_{im} < 1 \). Thus vaccination improves the odds of the individual to survive.
Each infected agent, during each time tick, might become healthy again or die. These probabilities were already discussed above, but then setting their values it is important to satisfy the following condition:
\begin{equation} p_{ih} + p_{id} \leq 1 . \end{equation}
The modeling might be further complicated by introducing the impact of immunity and vaccination (or drugs) to the probability to get healthy or die. But this complication is not necessary in our case.
Evidently the dead agent is not able to recover during any time tick.
This model does not take into account side-effects of vaccination (e.g., getting infected due to vaccination). Anti-vaxxers love this argument, but they forget that side-effects are single individual cases, while hundreds millions of people get vaccinated each year (if not more). In most cases it is hard to prove that vaccination caused the side-effect in question. Having this in mind we say that the probability of causing the side-effect would be extremely small and would not be observable in the model.
During initial time moment, we randomly assign one agent to be patient zero. It does not matter if his is vaccinated or not. Further spreading of the disease should be taken into consideration.
Results
As we already mentioned, the app allows to do the same experiment in two population groups. This was implemented in order to allow to compare how the disease spreads in population with low vaccination rate and in population with high population rate. Each population is represented by "geographical" view (i.e., the grid of agents is shown) and graph (which illustrates certain variables changing in time).
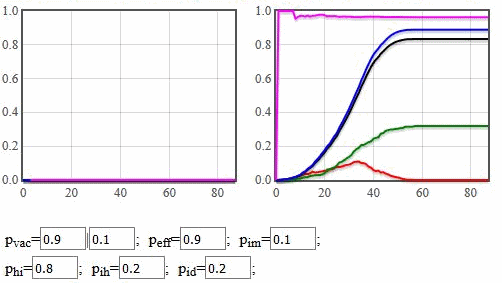
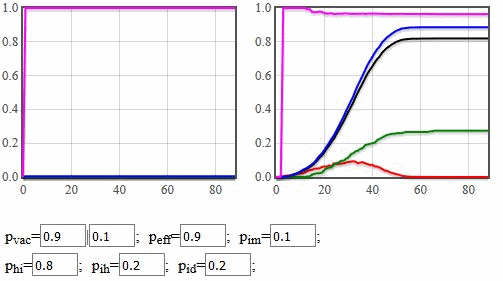
Red curve in graphs shows how the fraction of infected agents, \( N_{inf} / N \), changes in time. Black curve - fraction of dead agents, \( N_{dead} / N \). Green and blue curves - fraction of dead agents among vaccinated and unvaccinated agents, \( N_{dead,vac} /N_{vac} \) and \( N_{dead,unv} / N_{unv} \). Magenta curve - fraction of unvaccinated agents among dead agents, \( N_{dead,unv}/ N_{dead} \).
The last variable, \( N_{dead,unv} / N_{dead} \), makes no sense - it provides no useful information about the spreading of disease in agent populations. We consider it only because anti-vaxxers like to use one similar to it. They like to estimate the fraction of vaccinated agents among dead agents:
\begin{equation} \frac{N_{dead,vac}}{N_{dead}} =\frac{N_{dead}-N_{dead,unv}}{N_{dead}} = 1 -\frac{N_{dead,unv}}{N_{dead}}. \end{equation}
Anti-vaxxers prefer this variable due to a very simple reason. It is extremely easy to find cases, which would imply the conclusion, which anti-vaxxers would like to prove. But this approach is wrong (read more on Cherry picking and Sharpshooter fallacy). Why? Imagine we have only a single victim to the disease. What is the probability that it was vaccinated? \( p_{vac} \)! If vaccination rates are high, then usually the victim would be vaccinated. Lets say that disease took 10-20 lives. What is the probability that majority of them were vaccinated? Once again if vaccination rates are high, then it might be that there will be 50-50 chance that majority of victims would be vaccinated. So far the narration implies that it is dangerous to get vaccinated. But let us see how many lives will be taken if vaccination rates are low!
 Fig. 2:If vaccination rates are high, then you may obtain cases were majority of victims will be among vaccinated agents. If vaccination rates are low, everybody dies.
 Fig. 3:If vaccination rates are high, then you may also obtain cases were majority of victims will be among unvaccinated agents. If vaccination rates are low, everybody dies.
The important figure is the total number of victims and not the ratios between the vaccinated and unvaccinated victims. High vaccination rates prevent higher number of victims. Though, it is worth to note that there should be an optimal \( p_{vac} \) value, implying that it is not necessary to vaccinate everybody. Medical doctors usually recommend vaccines to patients based on their health record. If medical doctor believes that patient might suffer due to vaccination, the medical doctor will not make the recommendation. Some people might have certain health conditions, which would make vaccination dangerous to them. Yet the people who chose not to vaccinate due to other reasons put not only themselves, people unable to get vaccines and broader community in risk.
There will always be some individuals, who will not be saved by the vaccine. But vaccination helps to save millions of others!
HTML5 app
We invite you to play around with the app below to convince yourself that vaccination helps prevent disease outbreaks.
