Picky-shy model of dating apps
This is the final post (at least for the foreseeable future) on the statistical physics of dating apps [1]. In this post we will introduce two types of the users: some of them will be picky (giving likes predominantly to more attractive users), while some of them will be shy (giving likes predominantly to less attractive users). Who is more successful?
Picky-shy model
The model follows the premise of the dropout model with a difference that matched users are replaced (as in the replacement model). Also their decisions are based on a modified rule biased decision rule.
In this model biased decisions of the users depend on their type. But all the users perceive the difference between them and the other users they are interacting with. This perception is distorted:
\begin{equation} \delta_{ij} = x_j - x_i + s \Delta x, \end{equation}
with \( s = -1 \) for picky users and \( s = 1 \) for shy users. This is effectively the same as if users perceive themselves to be more (less) attractive than they truly are, if they are picky (shy).
Another modification is that now \( \beta \) parameter has two values, which are applied in two different cases (depending on the sign of \( \delta_{ij} \) and the type of the user). If the user is picky and \( \delta_{ij} < 0 \), then:
\begin{equation} P(i, j) = \exp\left[\beta_{max} \delta_{ij} \right], \end{equation}
but if \( \delta_{ij} > 0 \), then:
\begin{equation} P(i, j) = \exp\left[-\beta_{min} \delta_{ij} \right] . \end{equation}
If the user is shy and \( \delta_{ij} < 0 \), then:
\begin{equation} P(i, j) = \exp\left[\beta_{min} \delta_{ij} \right], \end{equation}
but if \( \delta_{ij} > 0 \), then:
\begin{equation} P(i, j) = \exp\left[-\beta_{max} \delta_{ij} \right] . \end{equation}
Heterogeneity in \( \beta \) parameter describes different eagerness to match with more (less) attractive users.
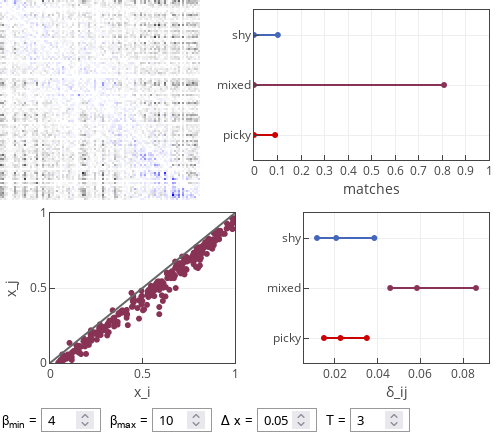
Interestingly, this change doesn't seem to have an effect on model dynamics. Both picky and shy users are matched with the same success rate. Though picky-picky and shy-shy pairings are rarer than a mixed pairing. Also, mixed pairs are more on equal (larger \( \left| \delta_{ij} \right| \) is observed for mixed pairs).
 Fig 1.Typical results of the picky-shy model. Note that mixed pairings are more common and they are also more unequal than the pure pairings.
The observed effect can be attributed to both heterogeneity in \( \beta \) and asymmetry in self-perception. But to observe effect of heterogeneity of \( \beta \) one would need to take really extreme values. For example, try setting \( \beta_{max} = 100 \) or \( \beta_{min} = 0 \).
Interactive app
This interactive app is essentially the same as in the previous post. Yet this one is focused on observing success of picky and shy agents. The top right plot shows the fraction of shy-shy pairings (labeled "shy") and picky-picky pairings (labeled "picky"), as well as mixed pairings. The bottom right plot shows 25% and 75% percentiles and median of \( \delta_{ij} \) for each of the pairing types. Feel free to explore. But as far as I can tell the situation of shy and picky agents is often symmetric.
References
- F. Olmeda. Towards a statistical physics of dating apps. arXiv:2107.14076 [physics.soc-ph].
