Quartiles of Talent vs Luck model
Here we continue our discussion on the Talent vs Luck model proposed in [1]. This time we offer you an app which allows you to explore quartile dynamics in this model.
Usually in statistics quartiles are values which split data in four equal parts. Here we use them to split data into four parts and then refer to those parts as quartiles. Namely the top 25% of data points are the first quartile (Q1), while the bottom 25% are the fourth quartile (Q4).
We will be spliting our agents into quartiles in three regards: talent, luck abd capital. Note that one agent can be in different quartiles for each of the regards: one can be the most gifted (talent Q1), the least lucky (luck Q4) and somewhat poor (capital Q3). We will be examining, how well the quartile in one regard predicts quartile in another regard. Below you can see a random simulation results.
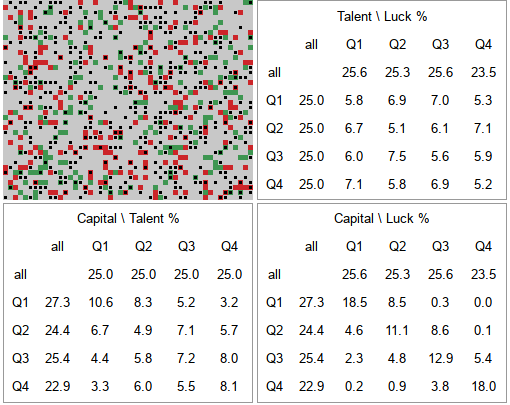
 Fig. 1:Results of a random simulation with 'no redistribution' redistribution strategy.
From the top right figure we see that talent (columns) does not predict luck (rows). All values in the table are reasonably close to each other. This is rather obvious result as the model does not assume any relationship between those two regards.
From the bottom left figure we see that talent (rows) is not a good predictor of capital (columns). While 40% of the talent Q1 (10.6% of all) agents end up in capital Q1, talent Q2 agents are almost as likely (34%) to end up in capital Q1 (almost twice as likely than ending up in capital Q2).
From the bottom right figure we see that luck (rows) is not perfect, but quite good, predictor of capital (columns). There is around 50% chance for agent in any quartile in regards to luck to end up in the same quartile in regards to capital. Though this chance is lower for Q2 and Q3, but higher for Q1 and Q4 (which is likely explained by outliers).
HTML 5 app
Feel free to explore a new app, which is essentially identical to the one from the redistribution post. It just shows three quartile tables instead of plots. Check whether the redistribution strategies are effective from this point-of-view rather from the earlier. Their effects should be the same, but our intuitions might be different as we use different tools to understand them.
References
- A. Pluchino, A. E. Biondo, A. Rapisarda. Talent versus Luck: The role of randomness in success and failure. Advances in Complex Systems 21: 1850014 (2018). arXiv:1802.07068 [physics.soc-ph]. doi: 10.1142/S0219525918500145.
