Another model of high clustering in scale-free networks
Previously we have already mentioned that there are three main statistical features of networks. The most problematic of them appears to be clustering as random networks do not naturally form local, tightly interconnected, communities. In the previous text we discussed a simple model, which produces highly clustered scale-free networks. The problem is that it is rather hard to relate that model to any real complex system. In this text we will attempt to solve this problem.
Formulation of model
- Start with an empty graph with \( m_0 \) nodes (in our applet \( m_0 = m \)).
- During the following steps add one new node and \( m \) links:
- First link is chosen according to (a) preferential attachment (see description of Barabasi-Albert model).
- Other \( m-1 \) links may be formed (b) with neighbors of the node previously selected with preferential attachment (this mechanism is called "triad formation") or (a) with other nodes selected using preferential attachment. Mechanism (b) is executed with probability \( p \) and mechanism (a) with probability \( 1-p \).
 Fig. 1:Two network formation mechanisms in the discussed model. In subfigure (a) we see a node 'u' was selected via preferential attachment mechanism, next using triad formation mechanism node 'w' was chosen (subfigure (b)). Note that crossed out nodes cannot be selected with triad formation mechanism as one of them is 'u' node, while other are neighbors of 'w', but not neighbors of 'u'. Figure taken from original article (see references).
We would like to claim that "triad formation" mechanism is rather realistic as similar mechanics are behind social interactions between humans. We first get to know a certain person and only then he may introduce us to his friends.
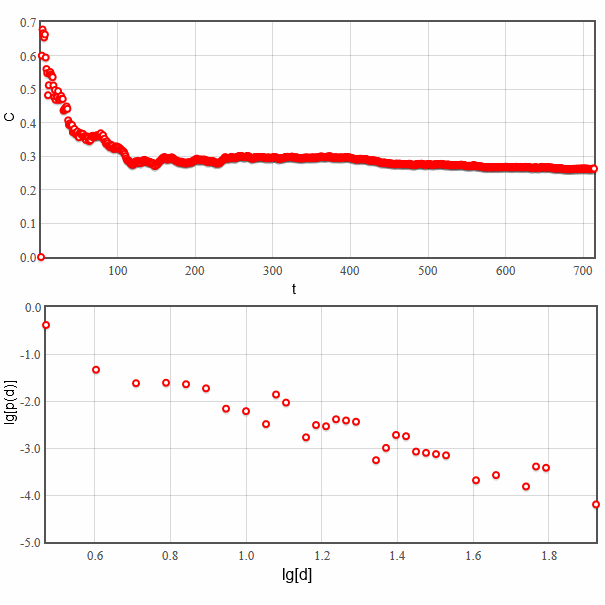
This model was proposed and thoroughly analyzed in [1]. This model is known to generate scale-free networks, but the clustering coefficient in networks generated using this model is positive (the precise value depends on both model parameters). Typical evolution of clustering coefficient as well as degree distribution are shown in the figure below.
 Fig. 2:Evolution of clustering coefficient with the increasing number of nodes (as time), also node degree distribution.
We invite you to test this model using our interactive applet.
Note that graph layout (figure on the left) is not updated automatically. It was disabled to conserve processing power of your computer. But graph layout maybe updated manually by pressing "Redo node layout".
References
- P. Holme, B. J. Kim. Growing scale-free networks with tunable clustering. Physical Review E 65: 026107 (2002). doi: 10.1103/PhysRevE.65.026107.
