Baltic countries should continue EU leadership in the sustained economic growth
In the previous text we considered statistical information from various sources, exhibiting sustained economic growth of Baltic countries. Now with some confidence we can conclude that even world financial crises has made only short-term impact on the stable growth trend. The Baltic States once again are taking economic growth leadership in EU and will seek to sustain these positions in the nearest future.
The particular role of exports in the recovered economic growth confirms presumptions regarding exceptional manifestation of Balassa-Samuelson effect in Baltics. Nevertheless, one needs more arguments, why this effect contributes more in the development of Baltic region then others. For example, the Visegrad countries, having a similar level of gross domestic product (GDP), should have the same development rate. In this contribution we would like to draw your attention at the statistics of gross earnings, leaving details of macroeconomic modeling aside, as labor earning is a key parameter in all models.
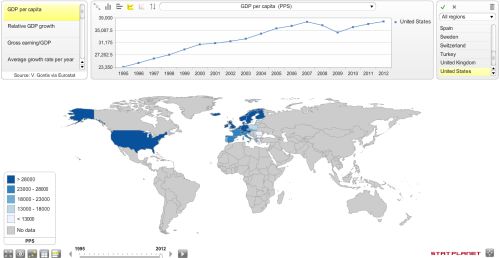
Seeking to improve presentation of statistical data, we use the graphical software package StatPlanet built for the data mapping and visualization. Our analyses of labor earnings in connection with GDP growth is based on Eurostat data. We choose the time interval from 1995 to 2012 as long as available data from Eurostat for the Baltic countries given in purchasing power standards (PPS). These countries and their convergence to the EU economic area is our main interest in this analysis. We use two data sets: GDP in market prices and labor gross earnings given in PPS. Other presented variables are simple functions of these two basic sets.
Interactive program StatPlanet plots three time series (t.s.) in the year interval from 1995 to 2012:
- GDP per capita in PPS,
- Relative GDP growth, GDP(year)/GDP(1995),
- Ratio Gross earning/GDP current year.
And two averages of time series in the considered time intervals:
- Average growth rate per year,
POWER(10;LOG(BVP(2012)/BVP(1995))/17)-1)*100, %, - Average of ratio gross earning/GDP.
One can interactively choose plot parameters exhibited by the FLASH applet and analyze three time series and two their averages for the all EU countries and few main EU partner countries. We do aim to discuss in more details economic growth of Baltic in comparison with other countries. We would like to draw your attention ones again that the relative economic growth (t.s. 2) of all Baltic countries practically coincide and considerably overcome all other countries exhibited. Note that relative economic growth of Baltic countries is higher during all period in comparison with more developed and less developed countries and the trend is sustained even after the hard impact of world financial crises. See Fig. 1 giving an interactive plot screen short of relative GDP growth. From our point of view the negative impact of financial crisis has been conditioned by the collapse of credit flow more than by seeming endogenous macroeconomic disproportions in Baltics.
/GDP(1995).") Fig. 1:Relative GDP growth of EU contries in the period 1995-2012, map of GDP(2011)/GDP(1995).
Fig. 1:Relative GDP growth of EU contries in the period 1995-2012, map of GDP(2011)/GDP(1995).Having in mind that labor cost is indispensable part of macroeconomic growth models, we do propose to take attention at the time series of gross earning and GDP per capita ratio, t.s. 3. These time series do not coincident as well as relative growth series do for Baltic countries. Nevertheless, it is obvious that series of Latvia and Estonia coincide pretty well. Baltic countries do not have particular values of gross earnings: there are more countries with similar level of labor costs. It is worth to note that the ratio of gross earning and GDP for Baltic countries is stable in the period considered and do not overcome the value 0.9. Only Latvia was approaching this level just before crises started. Lithuania during all period has slightly lower level of gross earning. We can argue that Lithuania has some space for more active local market and higher labor costs.
The mapping of gross earning and relative GDP growth in Europe reveals negative correlation of these two variables, see Fig. 2 and Fig. 3, exhibiting average growth rate and average gross earning respectively. This correlation seems even stronger for the more developed countries than for developing one. For example, Ireland, Luxemburg and Norway have higher relative growth rates and lower relative gross earnings.
 Fig. 2:Map of average GDP growth per year of EU countries in the period 1995-2012.
 Fig. 3:Map of average relative gross earning in EU contries, 1995-2012.
It is worth to switch from the averaged view to the more detailed time series of various countries revealing possible problems of economic growth related to the increasing levels of gross earnings. One can observe from the data that economic growth of countries in South Europe: Italy, Portugal and Spain, discontinues when gross earning approaches GDP per capita. It is accepted in research literature that for countries with similar level of development the Balassa-Samuelson effect is already spent. Probably, too high levels of gross earnings for these countries can be one more obstacle for the competitiveness of their economies. It is too early to make certain conclusions regarding financial austerity measures for South Europe, it is not clear whether this will bring competitiveness and new economic growth. For example, the collapse of economy in Greece is accompanied by some growth of relative gross earning. Only in Portugal one can observe some decrease in earning level, which, probably, will bring back competitiveness and growth.
In comparison with other EU countries the level of labor costs in Baltics remains low in all period considered and so secures competitiveness of investment. We do hear arguments that currency board or introduced Euro can become an obstacle for the developing countries restricting monetary instruments to adjust appropriate level of labor costs and increase competitiveness. Such kind fear was especially strong in the beginning of financial crises. A Baltic country, each in her particular way, has proved that there is wider choice of financial austerity measures and appropriate macroeconomic environment together with EU integration process can secure sustained economic growth. From our point of view, the economic growth based on exports of countries in the environment of international economic depression and experiencing stable decrease in domestic credit level gives us a message that these countries still have unused resources for further economic development. Statistical data reveals that Lithuania has additional opportunities for the development of local market, as the impact of financial crises is too much reduced level of local labor earnings.
The more detailed economic growth analyses of Baltic countries should have value in the general context of EU development. Slovakia exhibits rapid development as well, there is good opportunity to make comparisons with slower development of Czech Republic. The exceptional interest has to be given to study economic development of Turkey, as this economy potentially can impact further development of EU. The sustained economic development of all these and other Central and Eastern European countries has to be considered as good applications of New International Macroeconomics. Unfortunately, there is obvious lack of attention for such research in Lithuania.
