V. Gontis: The triumph of Penn effect in Europe
The idea of this contribution has come after the publication in The Economist The Big Mac index. Such index was introduce to explain the concept of real currency exchange rate needed to deal with the problem of varying price levels in different countries. The different price levels cause the different purchasing powers of the same currency around the world. For example, the network of fast food restaurants around the world McDonald’s serves everywhere the same products, consider one of them - Big Mac. Having in mind the same quality of the product we do observe different prices of Big Mac around the world and so have to accept the varying prices or purchasing powers of the same currency, say USD. It was thought from the beginning that such effect must be temporal and exchange rates have to converge towards equilibrium where Big Mac prices equalize. Unfortunately, this do not happen, the different price levels around the world is very stable phenomena and statistically prices are higher in countries with higher incomes. This statistical phenomenon was called Penn effect and economists Balassa and Samuelson in 1964 independently explained it as a result of different productivities in tradable and not tradable sectors of the economy. The research in contemporary international macroeconomics forces us to acknowledge that this phenomenon is much more general and Balassa Samuelson effect is only one of all possible explanations.
This should be obvious that the problem of economic convergence we are interested might have roots in Penn effect. If price levels and productivities had a tendency to equalize around the world, it should be possible to assume that the statistical leverage of prices is a similar process as leverage of temperatures in thermodynamics. Unfortunately, such convergence is still disputable and can be observed only as conditional process. We as Europeans need an answer to the question: is the geopolitical and macro economical EU experiment favorable for the economic convergence of EU members? Or skeptics are right? The countries will tend to the economic differentiation and disintegration and such union is not stable. We just look for the quantitative estimation of real processes in Europe comparing it to the rest of the world. To achieve a more solid statistical background we have to switch from the popular Big Mac index to the well-established method of purchasing power parities (PPP), giving us an evaluation of price levels aggregate GDP.
Here we present interactive graphs based on the World Bank and Eurostat data. The PPP method gives us the countries price level aggregate GDP and the GDP evaluated in purchasing power standards (PPS), accounting different price levels and different purchasing powers. The most visual method to present this data and to exhibit the strength of Penn effect is a GDP and price level scatter plot of countries. It is very helpful to use StatTrend software just developed for such task. The interactive interface of such visualization gives us an insight into world development and specific fluctuations during the crises. We present the data in the time interval from 1995 to 2012 including the periods of EU extension and last global crises.
The statistical data can be viewed combining six variables: PriceLevel, GDPpercapitaUSD, GDPpercapitaPPP_USD, LogPriceLevel, LogGDPpercapitaUSD, LogGDPpercapitaPPP_USD. Notations of variables are self-explaining; GDP is presented accounting PPP and just in current USD for comparison. We introduce Log scale as more appropriate for the exponential processes such as economic growth. For more detailed reference to data source take a look at information given in the Appendix. There is a possibility to view data as time series or column charts, just click on the appropriate icon. Very impressive is the scatter plot time animation with possibility to view economic growth trajectories of individual countries. In the right panel there is a list of countries distributed into six continental regions: Former Soviet Republics, Asia & Australia, Europe, Latin & North America, Middle East & North Africa, and Africa. Every region has his own color and you can determine it easily holding mouse over countries bubble. Let’s view the data, experiment yourself clicking on the Fig. 1, and then you can get acquainted with our observations.
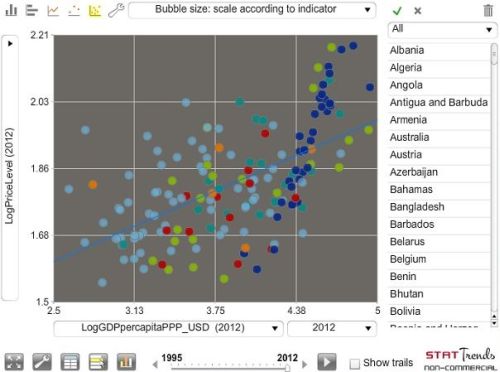
 Fig. 1:Penn effect. Scatter plot of World countries in the plane (LOGGDPpercapitaPPP_USD, LOGPriceLevel).
Looking at the world scatter plot for the pair of variables (LogGDPper capitaPPP_USD, LogPriceLevel) one can observe rather weak exhibition of Penn effect: countries are scattered in wide area around some trend line, which has a low coefficient of slope up, 0.15. There is very weak dependence of this view on the year considered. For the major part of regions the view is very similar as for the whole world: for the Former Soviet countries (except Baltic countries) slope is 0.13, for Asia slightly higher 0.22, Latin and North America exhibits slope 0.19, slope coefficient drops to the value 0.05 for the Middle East & North Africa and to the value 0.08 for the Africa. Only in Europe we can observe clear manifestation of Penn effect with very narrow scattering of countries around the steep trend, 0.69. The strong phenomenon for Europe is observed in the whole period of consideration and probably the data of economic development for European countries is the most suitable to check theories of international macroeconomics seeking to explain Penn effect.
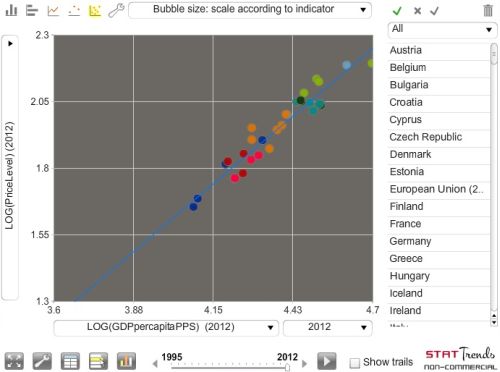
 Fig. 2:Penn effect. Scatter plot of Europian countries in the plane (LOGGDPpercapitaPPS, LOGPriceLevel).
We do have intention to analyze Eurostat data based on the PPP to get in more details of Penn effect manifestation in Europe. The method of visualization is really the same as in the previous consideration of World Bank data. Countries of Europe can be distributed into some regional groups as well; nevertheless, these groups are too small to determine specific trends of their scatter plots. Let us to exclude Luxembourg (center of international finance with very specific GDP structure), Bosnia and Herzegovina as well as Macedonia (very new countries in economic area of Europe) and Albania (the most closed economy) from the consideration. In such set of countries we do consider interrelated economic region with countries having various sizes and levels of income. Then we can expect the best determination of common trend in scatter plot and more reasonable evaluation of economic convergence in the region.
We slightly changed the list of variables and left only one GDP estimate in purchasing power standards (PPS). Then we add ratio GDP2012/GDP1995 as estimate of countries GDP growth in the period considered. The general result for European countries is really impressive: all countries appear in the very vicinity of the joint trend line witnessing the strong evidence of Penn effect for countries with strong economic interaction. The slope of trend line is 0.93 for the year 2012 and fluctuates from 0.77 to 1.0 in the whole period. In other words, the statistical effect just have become like a law: the relative difference in GDP between two countries is possible only in the case when relative difference in aggregate prices is of the same magnitude. Note that countries above the trend line likely have more problems in economic development than countries below, for example, Greece in the last period and Iceland in 2007 have too high price levels in comparison with GDP followed by real economic balance and development problems. It looks like the optimal development is achieved when countries GDP is in balance with price level, namely, countries should keep their trajectories of development very close to the joint trend of their scatter plot. Certainly, such ideas have to be considered and proved in much more detailed studies. Now we just consider it as an idea how to optimize development of community such as EU. We are pleased to notice that Lithuania has some space to increase local prices and non-tradeable sector in order to lever countries GDP.
We do care most of economic convergence in European region, whether it takes place, how rapid such process is, and which countries are most successful. One can observe an evidence of economic convergence looking at the growth trajectories of European countries. The most impressive view can be generated through animated scatter plot in log-log scale or alternatively one can analyze rations GDP2012/GDP1995 using column chart. The Baltic countries are leaders in economic growth among European countries, as their GDP per capita in PPS grew up 3.5 times in the considered period. Other countries of Central and Eastern Europe grew up more than old members of EU and so contributed to the common economic convergence.
The methodology to analyze economic growth on the bases of Penn effect introduces a new dimension of international macroeconomics, which is rarely considered as the main force of developing countries. The more deep insight into phenomenon might help to achieve better understanding of the role of economic integration seeking for the sustainable regional and world development. The geopolitical experiment of European integration just has to become an object of extensive macroeconomic studies. Unfortunately, there is a lack of information and understanding about real benefits to the developing countries to be integrated into such economic area as EU. A general public opinion is that the main source of economic convergence is the structural support implemented by EU. From our point of view the differences of price levels impact much higher capital and financial flows generating the observed rates of economic convergence. Any endeavor to eliminate restrictions for capital and financial flows in joint economic area contribute to the economic convergence as to the manifestation of Penn effect.
The experiences of economic development in Baltic countries deserve much higher attention. Arguments and explanation why and how Baltic countries succeed caching up Vysegrad group would contribute the theory and practice of international macroeconomics. The trends of development in Slovakia and Czech Republic would bring new understanding of economic convergence as differences in economic development being one of the reasons for disintegration before EU reversed into the new stage of economic convergence in the period of EU integration.
Interactive applets
- Click here for interactive applet with only European data.
- Click here for interactive applet with whole world data.
Appendix
The World Bank data can be retrieved using following information:
- GDPper capitaUSD - World Development Indicators, GDP per capita (current US$) - NY.GDP.PCAP.CD
- GDPpercapitaPPP_USD - World Development Indicators, GDP per capita, PPP (current international $) - NY.GDP.PCAP.PP.CD
- PriceLevel - World Development Indicators, PPP conversion factor (GDP) to market exchange rate ratio - PA.NUS.PPPC.RF
The Eurostat data is available as indicators:
- GDPpercapitaPPS - GDP and main components - Gross domestic product at market prices [nama_gdp_c], Purchasing Power Standard per inhabitant.
- PriceLevel - Price level indices (EU28=100), AGGREG95 Gross Domestic Product.
