V. Gontis, K. Acus: Economies of Baltic countries are catching up and overcoming Visegrad Group
Following our previous papers about economic convergence of Baltic and Visegrad countries and long-term development forecasting, we want to review the latest Eurostat data about Europe and OECD economies in purchasing power standards (PPS). There are at least three reasons for that. First of all, we look for the best way to compare GDPs between countries. Secondly, we seek appropriate and the most reliable data to model international macroeconomic convergence processes. Finally, we want to draw your attention at the latest Eurostat data, which stresses extremely strong growth of Baltic countries.
Economic development of the European Union member states is a live international macroeconomic experiment. Theoretical analysis and possible modeling of these processes is a real challenge to all analysts and theorists. EU experience would be much more useful if the running economic processes were understood from the macroeconomic theory point of view. Noticed laws would be handful, solving issues of the EU economy in the future. In our opinion, observed regularities follow especially stable trends. The observed regularities of macroeconomic trends could be useful to forecast long-term economic development in the manner of natural sciences. This could be done in much larger extent, than, for example, in the weather long term forecasting. In a previous article "The phenomenon of economic growth of Baltic countries" we used World Bank data to point on a particular universality of economic growth in different regions. There we partly revise the data by adding Scandinavian countries to already reviewed Baltic and Visegrad regions. In the first graph we plot GDPs in USD, current prices, of these EU members’ and Norway from 1995 to 2012. The same data is show in three different ways to stress various growth trends.
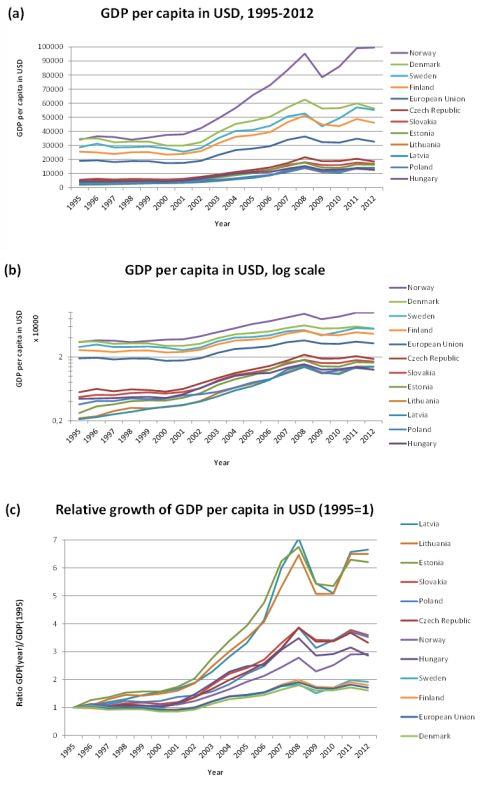
 Fig. 1:GDP in USD, current prices, of Baltic, Visegrad and Scandinavian countries is shown in three different ways from 1995 to 2012.
In graph (a), where GDP values are nominal, it is hard to distinguish any different growth trends and group countries according to them. While in logarithmic GDP growth plot, graph (b), it is possible to group countries to developed and developing ones. This partly shows the convergence of groups‘. This happens because an instantaneous economic growth is exponential one, according to the assumptions of neoclassical economics. Such growth can be shown in a logarithmic graph at its best. Exponential processes, when a variable gain is proportional to its instantaneous value, are common in many social events, while an economic growth is one of them.
In the third graph, (c), GDPs are normalized to give 1 in 1995. In such a way, 3 different GDP growth groups are revealed: Baltic, Visegrad and Scandinavian. Only the Norway is out of the order like an exception to prove the rule. Oil and gas production may be the additional home source for Norway to keep high investment level, probably.
The fact, that countries economic growth can be grouped easily according to its historic development, indicates that long-term development is influenced more by international macroeconomic environment, than by peculiarities of their internal economic policy. Existing exceptions show cases, when principal internal mistakes do not allow taking the advantages of favorable regional macroeconomic environment. Other exceptions, probably, show the cases, when a rich of natural resources country may outstrip other countries in a region. Only with the help of international macroeconomics models it is possible to highlight necessary conditions for economic convergence. The Harrod-Balassa-Samuelson effect has the largest influence to the development of international macroeconomic models dealing with the problem of economic convergence
The GDP measurement in US dollars based on World Bank data for European
countries may seem a bit disputable. Euro as a currency and Eurostat as
a data source might be a good alternative as more relevant to the
European economic area. So, for further comparisons we used the same
economic growth graphs as before, just switched from World Bank to
Eurostat data.
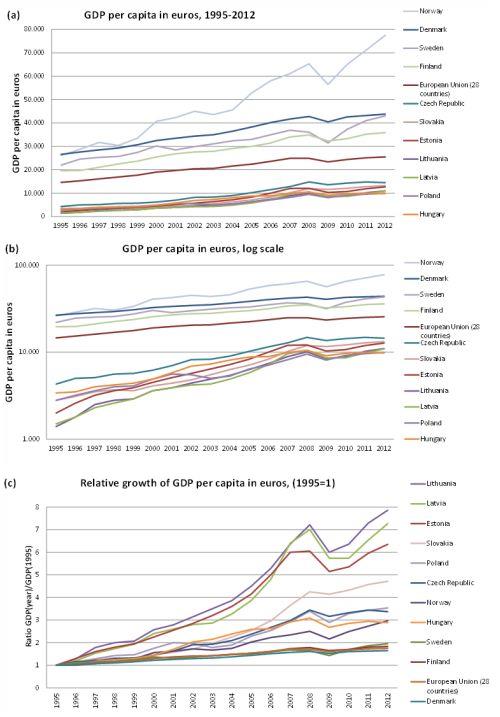
In the second figure GDP growth curves are shown in the same period,
just calculated in Euros with use of Eurostat data.
 Fig. 2:GDP in Euros, current prices, of Baltic, Visegrad and Scandinavian countries is shown in three different ways form 1995 to 2012 (Eurostat data).
As was expected, switching to Euro brings some changes to countries GDP long-term trends, as a result of significant EUR/USD exchange rate fluctuations during the period. But these do not change countries order according the GDP per capita value in 2012. While the countries order according the GDP per capita value in 1995 differs quite significantly, if we compare World Bank and Eurostat data. The reason for this is the correction of World Bank data performed for the Central and Eastern Europe GDP series during the period of fast social and economic transition until 1995-96. The correction was needed to link data from different socioeconomic periods. Transitions of Central and Eastern Europe countries, due to the social and political peculiarities, were quite different. Because of that, the correction of GDP data in 1995 differs for every country, this results in the different normalizing values used in graphs (c). The largest corrections were made to Slovakia - 29%, Lithuania - 19% and Latvia - 7%. This causes the significant differences of graph (c) in Fig. 2 comparing to the corresponding graph in Fig. 1. Relative GDP growth of Baltic countries based on Eurostat data is not so well concurrent, as using World Bank data. The Slovakia pretty well stands out with its larger growth from other Visegrad countries, when the data correction in 1995 is not used. One can conclude that long-term GDP growth trends using World Bank data are more universal and in larger extent reflect regional macroeconomic changes.
Our main conclusion is that we can clearly point out three regions with very different economic growth rates: growth rates of Baltic countries were the highest during all 1995-2012 period, growth rates of Visegrad countries were much lower than in Baltics, while growth rates of developed Scandinavian countries matched EU average. It is very likely, that such growth rates will remain at least in mid-term, let say 10 years, period. Although World Financial crisis seriously disturbed, but does not change significantly long-term trends. At least for the Baltic countries the World Financial crisis starts to run dry, and this brings a return to the rapid economic convergence of Baltics with EU.
Till now, we were more interested in comparison of the economic growth rates, than in accurate measurement of achieved GDP level. The question, how to compare quantitative GDP levels of countries achieved, is also very important and interesting. Comparison problem arises, because nominal GDP consist of two components: average price level and GDP volume (quantity). If price level was one in all countries, while it would be possible only in ideal market economy, it would be no problem. Then nominal GDP value would reflect its volume part. Unfortunately it is not the case, because a large part of services and goods that are included in GDP are not traded internationally. So, average (aggregated) price level differs between countries. A lot of efforts are requiared to separate GDP calculated in common currency and current prices in to comparative price index and GDP volume. It is generally accepted that the real economic strength is reflected in the GDP volume.
Eurostat data can be used to evaluate and compare GDP volumes. The database offers purchasing power parity (PPP) calculations to evaluate GDP in purchasing power standards (PPS). Such methodology eliminates from GDP comparisons exchange rate fluctuations and different purchasing powers in countries caused by the different price levels. GDP estimates in PPS are widely used by international organizations to evaluate countries economic strength. We are really interested to compare chosen countries taking in to account different price levels observed there.
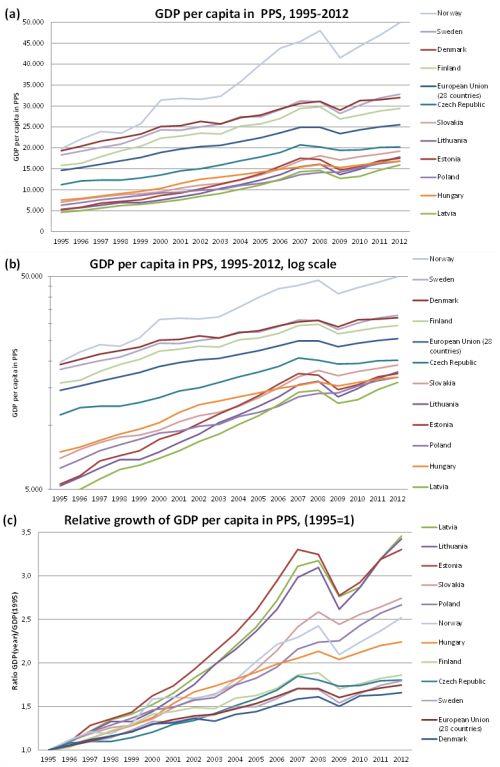
In the third figure, as in the ones before, we compare GDP per capita in PPS of Baltics, Visegrad and Scandinavian countries. Such GDP estimates make lower absolute differences between developed and developing countries. It is easy to explain the change, having in mind that price levels are higher in more developed countries (Penn effect).
 Fig. 3:GDP per capita in PPS of Baltics, Visegrad and Scandinavian countries from 1995 to 2012 is shown in three different ways (Eurostat data).
It is important to notice, that when we take in to account the price level differences between countries, we can get quite unexpected results of BVP comparisons. For example in 2012 Lithuania becomes a leader in Baltics and together with Estonia, they surpass Visegrad countries Poland and Hungary. One can easily observe other changes of comparison results between countries with similar development level. The newest Eurostat data gives us even more surprises comparing inhabitants’ real consumption. We will discuss it a bit later.
In the sense of long-term economic convergence the use of PPS does not cause any substantial changes. Of course, GDP growth in PPS of all countries, Fig. 3, graph (c), is significantly lower than in nominal GDP case. However, gaps between countries, that must be fulfilled, are respectively lower as well. So, quantitative convergence periods should not change, obviously, thanks to Penn effect. Ranking of countries according GDP growth rates remains very similar, even with the same exceptions, Norway strongly steps in between Visegrad Group. Interesting observation is that growth rates in PPS of Baltic countries are much more uniform, than the growth rates calculated in Euros, Fig. 2 graph (c). Notice that Latvia becomes slightly ahead comparing the growth rates between Baltic countries. Such coincidence of economic growth rates of Baltic countries observed almost in the period of 20 years, even more stresses the need of theoretical study.
Notice that in Visegrad Group the case is different: Slovakia significantly bypasses other countries, when Czech Republic significantly lags, comparing growth rates. But if we bear in mind, that Slovakia was less developed part of Czechoslovakia, it is possible that Slovakia‘s higher convergence rate partly slowdowns convergence rate of Czech Republic. If we considered these two countries as one, we would get high level of uniform development for Visegrad countries as well. More detailed look at the development of Czech Republic and Slovakia could be very useful in understanding of economic convergence.
Although a use of PPP and PPS are not so important for the economic convergence analyses, it brings substantial changes in GDP instantaneous comparisons from the practical as well as theoretical point of view. Valuation of Lithuanian economy using PPP should bring brighter view even for the greatest skeptics of this country. Now, in sake of curiosity, let’s focus on one more “surprise” regarding PPP valuation of Lithuanian economy.
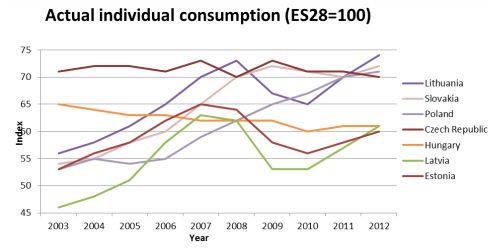
EU and OECD PPP research program attracts attention, than GDP per capita is not the best way to measure inhabitants’ living standards. It offers to use another indicator - actual individual consumption (AIC). This indicator is a part of real GDP, when it calculated in expenditure approach. Eurostat offers data for shorter - 2003-2012 period. We draw AIC curves of Baltic and Visegrad countries in Fig. 4.
 Fig. 4:Actual individual consumption of Baltic and Visegrad countries calculated by expenditure approach in PPP.
AIC data shows significant differences in GDP structure of countries, influenced by the internal economic policy. Baltic and Visegrad countries mix up in their AIC ranking. AIC index includes all kinds of individual consumption forms: direct individual consumption of goods and services, consumption of goods and services provided by the governmental or non-governmental organizations. Index value indicates what percentage of real services and goods consumes countries inhabitant compared to the average EU inhabitant consuming 100% of such services and goods. Lithuania becomes a sound leader according the AIC valuation of Baltic and Visegrad countries. Slovakia and Poland also are not far behind having similar GDP structure and growth trend. While Czech Republic and Hungary do not show any growth trends compared to EU average. Latvia by increasing its AIC values managed to outrun Estonia and is in the same position as Hungary. Eurostat data shows, that Baltic countries managed to catch up and are outrunning Visegrad countries not only by GDP per capita, but also by actual individual consumption. In Statistics you can believe or not, but Lithuania’s AIC outruns Estonia’s by 23%.
The latest Eurostat data discussed here raises a lot of serious questions. First of all, we need to understand why the Baltic countries reaching development level of Visegrad Group keep their relatively high growth rates. Secondly, what political and international macroeconomic fundamentals determine the long term growth? Finally, how could be possible to forecast economic development trends in mid-term at least? Our ideas and proposals on the subject we are going to present in our further articles.
