End of the world in 2026?
According to [1] the doomsday is likely to happen around year 2026. No, we will not die of some epidemiological disaster, but instead our population count will explode towards infinity. How this could happen? Maths.
Model
You are quite likely familiar with Malthus and Verhulst models of population dynamics. Both of which predict exponential growth of population under constant conditions. Verhulst only expands upon the idea by introducing limited resources, so the population will eventually reach certain maximum.
We have also written about Lotka-Volterra equations, which serve as a model of prey-predator interactions. Yet we, as human beings, do not suffer from any major predator. So Lotka-Volterra model does not apply to us.
1960 paper [1] suggested that Verhulst model doesn't apply to human population too. The authors proposed an idea that the available resources instead of being fixed (as is assumed in Verhulst model) grow together with the population. Due to increasing productivity and cooperation between humanity.
Malthusian model can be expressed as an ODE:
\begin{equation} \frac{d N}{d t} = \gamma N - \theta N = \alpha N . \end{equation}
In the above we have the natural reproduction rate \( \gamma \) and the natural death rate \( \theta \) as model parameters. We can combine these into a single effective rate of change \( \alpha \).
So, what if the effective rate of change is not constant, but a power-law function of population \( N \)? Then:
\begin{equation} \frac{d N}{d t} = \left( \alpha^\prime N^{1/k} \right) \cdot N = \alpha^\prime N^{1/k+1} . \end{equation}
Solution of this ODE is given by:
\begin{equation} N(t) = N_1 \left( \frac{t_0 - t_1}{t_0 - t} \right)^k . \label{eq:solution} \end{equation}
In the above \( t_0 \) is the doomsday day, \( t_1 \) is the reference year and \( N_1 \) is the reference population. Which is determined by the model parameters:
\begin{equation} t_0 = t_1 + \frac{k}{\alpha^\prime} N_1^{-1/k} . \end{equation}
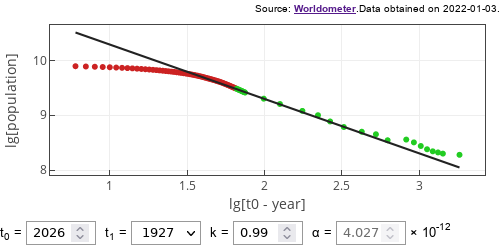
In the app below we will allow to change \( t_0 \) as a parameter instead of \( \alpha^\prime \). As \( \alpha^\prime \) has mostly lost its physical meaning. At least it is harder to pick proper value by the eye. In the original paper it was obtained by fitting the available data (it was estimated to be close to \( 5.5 \cdot 10^{-12} \). You will be able to see the value of \( \alpha^\prime \) as you change other parameters.
 Fig. 1:Data (points) against model prediction (line). Points come in two colors: green dots show data of the period prior to publication, red dots show data of the post-publication period.
In the figure above you see a reasonably close reproduction of the papers [1] results. Green dots should be quite close to the ones used by the authors (as we use different a source for the data), while the red dots represent data newer than the article. As can be easily seen - the doomsday was "averted" sometime around year 2000.
What went wrong? The model is interesting and thought provoking. It was a good fit for the data available at the time. Yet, to me Verhulst's assumption about finite resources seems more than reasonable. And in my opinion this model lacks exactly that.
Interactive app
Using this app you can change the Eq. \eqref{eq:solution} parameters and see whether the model fit is to your taste. For example, if you predict doomsday, \( t_0 \), to happen around 2100 and set \( k = 1.17 \), you will also get a reasonably nice fit. Try and verify!
References
- H. von Foerster, P. M. Mora, L. W. Amiot. Doomsday: Friday, 13 November, A.D. 2026. Science 132: 1291-1295 (1960).
