Facebook contest data set explanation
During summer hiatus I have promised to look into a data set I have extracted from one particular Facebook contest. While many Facebook contests are not based on any logical reasoning, this contest appeals to me as it appears to require at least some thought or expertise.
Last time I have briefly explored the data set. Now I will try to build models for the event-space observations.
The simple random model
For a first model let us simply consider that probability to get a comment with an answer 5 is fixed, \( p \).
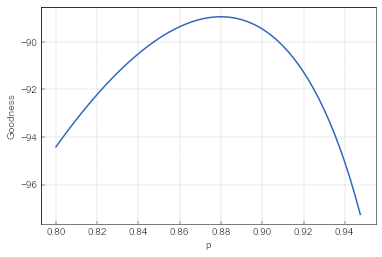
 Fig. 1:The goodness of simple model with different \( p \) values.
As one can see in Fig. 3 the best \( p \) is around \( 0.88 \). Here I measure goodness as a sum of log-probabilities of the events that occurred. As I operate in the event-space, I can ignore the inter-event time.
The simple herding model
Next lets consider a bit more sophisticated model. Let us assume that the probability to get a comment with an answer 5 depends on the current number of comments with an answer 5:
\begin{equation} p ( X_5 \rightarrow X_5+1 ) = \frac{\varepsilon + X_5}{2 \varepsilon + X_5 + X_o}. \end{equation}
Note that the equation above also includes \( X_o \) which represent the number of other comments. Hence we have to define the probability for an increase in \( X_o \):
\begin{equation} p ( X_o \rightarrow X_o+1 ) = \frac{\varepsilon + X_o}{2 \varepsilon + X_5 + X_o}. \end{equation}
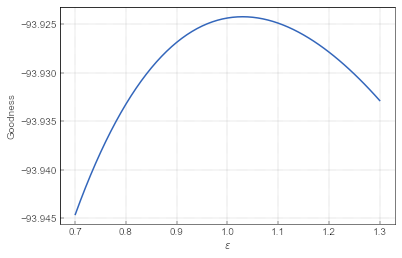
 Fig. 2:The goodness of simple herding model with different \( \varepsilon \) values.
As we can see in Fig. 4 the model seems to work best with \( \varepsilon =1.03 \). So which model works better? The simple random model at its best produces goodness measure of \( -88.95 \), while the simple herding model at its best produces goodness measure of \( -93.92 \). Though the difference appears small, the simple random model seems to outperform the simple herding model.
The simple local herding model
Lets build another simple herding model, but now let the probabilities to be proportional to the respective fractions of comments:
\begin{equation} p ( X_5 \rightarrow X_5+1 ) = \frac{\varepsilon + \frac{X_5}{N}}{2 \varepsilon + \frac{X_5 + X_o}{N}}, \end{equation}
\begin{equation} p ( X_o \rightarrow X_o+1 ) = \frac{\varepsilon + \frac{X_o}{N}}{2 \varepsilon + \frac{X_5 + X_o}{N}}. \end{equation}
Because of this form of the transition probabilities I will refer to this model as the simple local herding model.
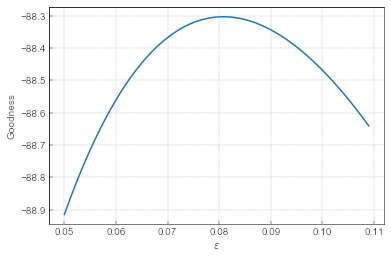
 Fig. 3:The goodness of simple local herding model with different \( \varepsilon \) values.
As we can see in Fig. 5 the model seems to work best with \( \varepsilon =0.081 \). This model outperforms the simple random model as it produces a better goodness measure of \( -88.3 \). Though once again the difference appears to be small.
One could add further sophistication to the model, such as introducing asymmetry into the model. Yet such sophistication no longer bring significant improvements. In case of asymmetry, different \( \varepsilon \) values for "Guess 5" and "other", goodness measure increases to \( -88.21 \).
Interim conclusion
Though I cannot claim statistical significance, I am inclined to conclude that herding behavior is strong in this data set as there are few reasons to prefer 5 over other possible answers besides initial dominance of the comments with answer 5.
Another important notice is that local herding model works better than global herding model. This basically mean that people read only a few comments before copying the prevalent answer. Thus it is not very probable that mathematically literate comments (the ones pointing out that there are infinitely many answers) reached the broader audience.
Next time
Next time I will build Bass model with day-night pattern to reproduce the temporal saturation pattern discussed previously.
