Facebook contest data set: Reproducing day-night cycle
During summer hiatus I have promised to look into a data set I have extracted from one particular Facebook contest. While many Facebook contests are not based on any logical reasoning, this contest appeals to me as it appears to require at least some thought or expertise.
Last time I have briefly explored the data set. Now I try to build models for these observations. This time I will consider the day-night cycle.
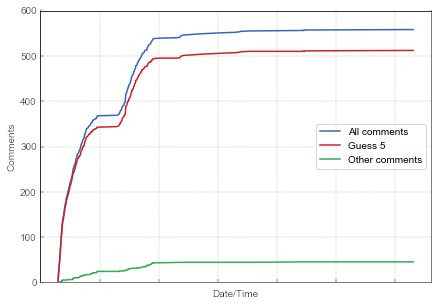
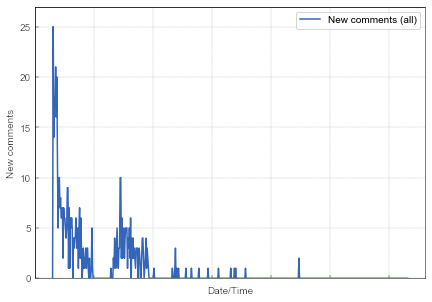
In our exploration we have encountered a peculiar pattern. We have observed the expected growth of the number of comments, but we have also observed a couple saturation plateaus. In this post we are interested in reproducing the blue curves from Fig. 1 and Fig. 2.
 Fig. 1:The growth of the number of comments. Blue line gives the total number of comments, red line indicates the total number of comments which have guessed 5, while the green line summarizes the total number of all other comments.
 Fig. 2:Number of new comments (all) per time window of 15 minutes.
In the previous post I have speculated that the saturation plateaus are related to the sleeping habits of the contest participants, because they occured during night time. I will build the sleeping habits into the well-known Bass diffusion model. I have selected this model, as it otherwise replicates the general "sigmoid" shape of the growth.
Now lets assume that there are two special times in each day (each day lasts for 1440 minutes):
- after \( T_{\text{wakeup}} \) each day people start waking up (at the rate of \( \lambda_{\text{wakeup}} \) per person per unit of time),
- after \( T_{\text{sleep}} \) each day people start going to sleep (at the rate of \( \lambda_{\text{sleep}} \) per person per unit of time).
The people who are not asleep can submit their comment to the contest (but no more than once). The probability that they will comment is proportional to the number of comments present.
This model can be easily implemented using the Gillespie method [1]. The program will have to consider five different event rates: two going to sleep rates, two waking up rates and single commenting rates. These rates must be updated after every event occurring as well as at those special times.
We invite you to explore the dynamics of the modified model by using the interactive HTML5 app below. The app will present you with two figures: the top figure will show the total number of comments (red curve) as well as the total number of awake agents (blue curve), the bottom figure will show the number of new comments per 15 minute window (red curve).
References
- D. T. Gillespie. Exact Stochastic Simulation of Coupled Chemical Reactions. The Journal of Physical Chemistry 81: 2340-2361 (1977). doi: 10.1021/j100540a008.
