The Main Reason for Lithuania's Economic Success - Low Private Debt
Assoc. Prof. Lesya Kolinets, lecturer in international macroeconomics at VILNIUS TECH and professor at Ternopil National Economic University, and I prepared a scientific manuscript [1] on the economic development of Central and Eastern European (CEE) countries from 1995 to 2024. The results of this study may be of interest to a broad audience seeking to gain a deeper understanding of the reasons behind Lithuania’s economic success since regaining independence. Using relatively simple econometric tools, we identify the key macroeconomic and financial components of CEE economic growth, among which low private debt accumulation emerges as a particularly significant factor.
Although the article has not yet been published in any economics journal, we wish to share its findings with experts in Lithuania. Your thoughts, criticisms, and suggestions could help to improve the paper and extend the study in a broader context.
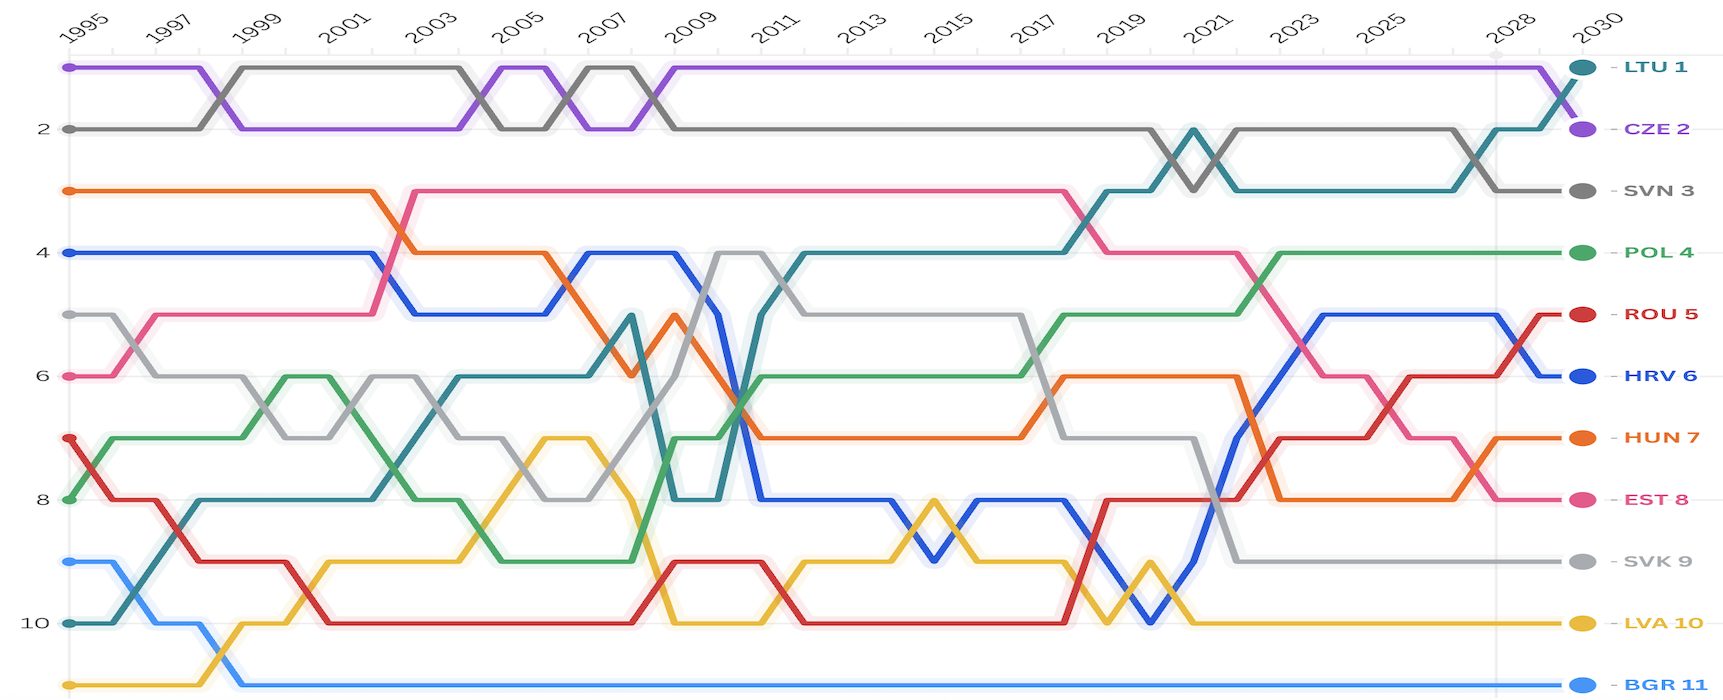
This brief overview, designed to capture readers' interest, is accompanied by several figures that illustrate the results. The motivation of the article stems from the desire to understand how Lithuania could rise from tenth to first place among eleven CEE countries in the period from 1995 to 2030. Such a forecast is provided by the International Monetary Fund in its World Economic Outlook (see Fig. 1).
 Fig. 1:IMF data: ranking of CEE countries by GDP per capita in Purchasing Power Parity (PPP) terms, 1995-2030.
This forecast is far from arbitrary, since as of 2024, Lithuania's GDP level is only slightly below that of the Czech Republic and Slovenia. Comparison with Latvia and Estonia is also essential, as all three Baltic states began their development path from nearly identical historical, political, and economic starting points.
 Fig. 2:Comparison of the Baltic states. The first panel shows GDP per capita in PPP terms; the second, the accumulated debt of private firms and households to banks.
In the second figure, it is evident that Lithuania’s economic leadership among the Baltic states emerged after the 2008 financial crisis, as the country had accumulated the lowest private indebtedness to banks in the preceding period. This is no coincidence—our analysis confirms the same finding within the broader set of CEE countries. To explore this, we employ a time-varying coefficient linear regression of GDP growth on price level, foreign direct investment (FDI), foreign trade, domestic capital investment, government debt, private debt, and GDP level. These components shape GDP dynamics in all countries in a similar qualitative way; only their quantitative contribution differs. Figure 3 illustrates how the components collectively contribute to the overall result for the Baltic states.
 Fig. 3:Contribution of components to GDP per capita in the Baltic states. Total represents the sum of all components and coincides with the empirical GDP level for each country.
The pattern is very similar for other CEE countries: after 2008, the absolute contribution of the price level, GDP, and private debt increases markedly. A negative sign of contribution means that the component hinders GDP growth. The strong positive relationship between the price level and GDP corresponds to the Penn effect and the Balassa-Samuelson hypothesis. The negative contribution of the achieved GDP level is consistent with classical growth theory. The contribution of the remaining components also accords with previous economic studies. The particularly strong influence of private debt is a novel finding of this research, one that deserves attention in both practice and theory.
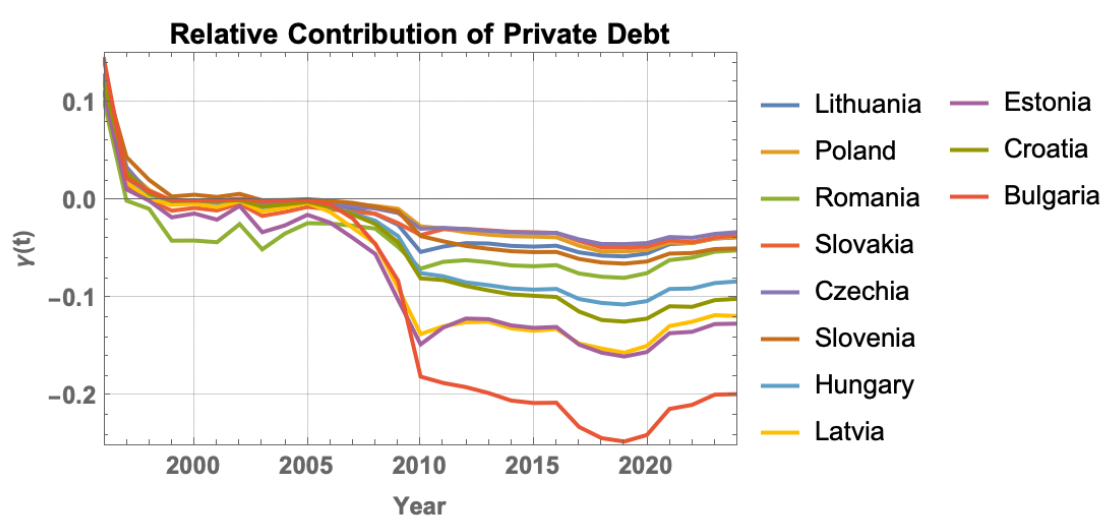
Emphasizing the exceptional role of private debt in the economic growth of CEE countries, we also plotted its relative contribution compared to other components (see Fig. 4).
 Fig. 4:Relative contribution of private debt to the economic growth of CEE countries; methodological details are provided in the scientific manuscript.
This illustration clearly demonstrates that the post-2008 economic growth of CEE countries has been driven mainly by accumulated private debt. This finding significantly contributes to explaining Lithuania’s macroeconomic success and may be valuable for the further development of theories on economic growth.
Note. This text was originally published on gontis.eu. Some changes may have been made to make the content fit Physics of Risk presentation style.

Acknowledgement. This post is based on research conducted by Vygintas Gontis while being affiliated with Institute of Lithuanian Scientific Society as well as with our group (dual affiliation).
References
- L. Kolinets, V. Gontis. Panel regression for the GDP of the Central and Eastern European countries using time-varying coefficients. arXiv:2510.04211 [q-fin.ST].
