Compartmental voter model and UK census data
We are concluding the ongoing series of posts on the compartmental voter model. As in [1] we will conclude with comparing the model against UK census data. Though note that the interactive app does not allow for the comparison - it just allows to generate semi-realistic spatial rank-size distributions.
Comparison figures from the article
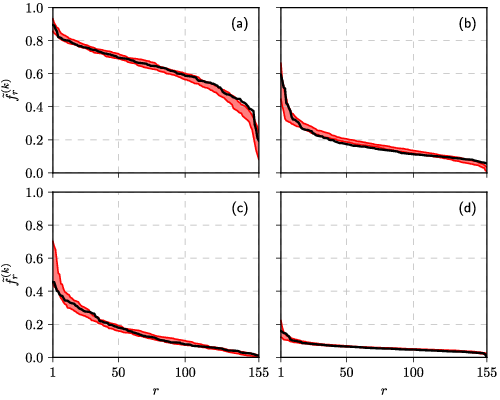
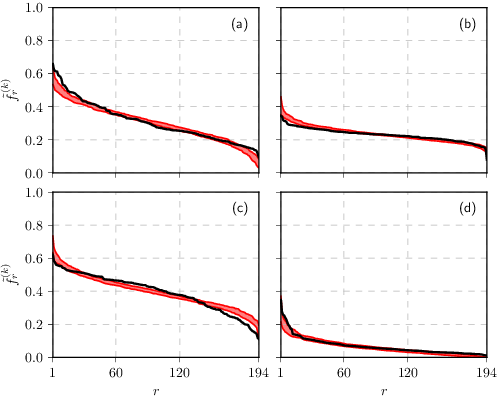
All of the following figures report spatial rank-size distributions for the empirical data (black curves). While the simulation data is represented by the red shaded area, which shows 95% confidence interval. While the agreement is not excellent, the differences are quite easy to explain - not all socio-demographic categories (social identities) are as important when making choice on where to live.
 Fig. 1:Ethnic group distribution in London: (a) White, (b) Asian, (c) Black and (d) other.
 Fig. 2:Religious group distribution in Leicester: (a) Christians, (b) no religion and (c) other.
 Fig. 3:Working class distribution in Sheffield: (a) top, (b) middle, (c) bottom and (d) unemployed.
Interactive app
The app we make available with this post is quite similar to the one from the earlier post. Yet this one has larger preset \( T \) value, which accompanied buy UI elements, which allow to make agent types statistically distinguishable. Note that this app is somewhat resource hungry and thus might be quite slow.

Acknowledgment. This post is based on research which was carried out as a part of the postdoctoral fellowship ''Physical modeling of order-book and opinion dynamics'' (09.3.3-LMT-K-712-02-0026) project. The fellowship is funded by the European Social Fund under the No 09.3.3-LMT-K-712 ''Development of Competences of Scientists, other Researchers and Students through Practical Research Activities'' measure.
References
- A. Kononovicius. Compartmental voter model. Journal of Statistical Mechanics 2019: 103402 (2019). doi: 10.1088/1742-5468/ab409b. arXiv: 1906.01842 [physics.soc-ph].
