Granovetter's threshold model
Here on Physics of Risk we once again present you a model of collective action. Last time we have considered Standing Ovation Model by Miller and Page, in earlier years we have written a lot about Kirman and Bass models, as well as correspondence between them. There is another classic model, which will be covered in this post, which models human intention to join the collective political action with inherent risk. In this text we will consider a threshold model proposed by Mark Granovetter.
Model
This model was built around the idea that people belonging to different socio-demographic groups differently perceive risk to express their internal political attitudes. One could interpret these differences in perception as a differing thresholds typical for certain socio-demographic groups. Once the threshold is passed, the members of the group start to express their attitudes. Usually via protest.
Lets us say that there is a certain number of activists, which no longer care about their own safety. They will protest no matter how hard the regime tries to suppress the protest. If their number is large enough, it is possible that the perceived risk of expression will decline with growing number of protesters. Then the activists will be joined by the other less fearful groups. For example - students. As the students join the protest, the level of perceived risk will further decline and other more fearful groups will join the protest. As long as everything goes well, soon everyone will join the protest.
What do we mean by "everything goes well"? If the people are unhappy with current politics, they should definitely express their attitude! Let us consider 5 groups of agents, which are not satisfied with the current situation in their country. For the sake of simplicity let us say that all these five groups have exactly the same amount of agents. Let us furthermore assume that they act according to the following rules:
- Agents in the 1 group are activists, they will protest no matter what,
- Agents in the 2 group, will join the protest if it is larger than 25% of the population,
- Agents in the 3 group, will join the protest if it is larger than 30% of the population,
- Agents in the 4 group, will join the protest if it is larger than 25% of the population,
- Agents in the 5 group, will join the protest if it is larger than 40% of the population.
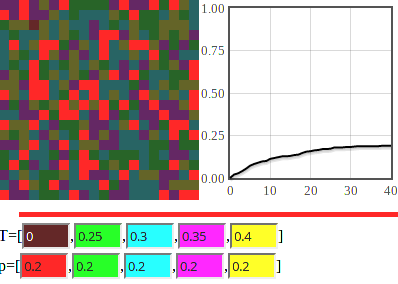
How large the protest will be? The answer is rather simple - despite everyone being unhappy with the regime, only 20% (all agents in group 1) will join the protest. It is so because the members of group 2 have a large threshold of 25%.
If the threshold is set to a lower value, lets say 15%, then the protest will eventually involve everybody.
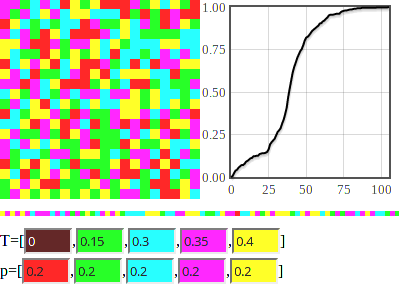
By changing number of group, their respective sizes and thresholds we could produce protests of different sizes. We could also neglect separation into groups and assign each agent his own, possibly randomly picked, threshold. In such case we could reproduce not only the size of the protests, but also their "diffusion" curves. All of these curves would have a sigmoid, stretched letter S, form. Similar curves may be obtained from the Kirman and Bass models, which suggests certain similarity between the three models. Kirman and Bass models require less assumptions, but also have less explanatory power in sociological terms.
Interactive HTML5 app
This post was illustrated using figures generated using app below. Our app uses modified interpretation of the original threshold model - namely it includes time axis. During each time step of the model a random agent is selected:
- If the agent has already joined the protest, then nothing happens.
- If the agent has not yet joined the protest, then he may do so. But only if the threshold assigned to his group, \( T_i \), is smaller than the number of agents currently protesting.
The model is not spatial, thus the grid on left is just for the illustrative purpose. On the right side you should see a plot, which shows how the number of protesting agents evolves in time. Below the two figures you should see previous "history," which contains groups agents of which have recently joined the protest.
In the app below you can change the size of the grid (total number of agents), threshold of the 4 groups, \( T_i \), as well as population fraction of agents in these groups, \( p_i \).
We invite you to try this app!
