Point process with normal inter-event times
I have also attended couple of conferences in the end of October. At International Conference on Noise and Fluctuations I got asked a question the gist of which was what would change in my model, if inter-event times would be normally distributed. I would expect that, in the particular case I was talking about, little would change, but let us make sure of that. In this post, we will take a look at point process, and we will revisit a more complicated topic I talked about later on.
Intuitive approach
As in the case of Weibull distributed inter-event times, analytical derivation is quite problematic. While the characteristic function of the normal distribution is notably less complicated, the complication is introduced further on by the fact the we need to consider truncated distribution as we can't allow for the negative inter-event times.
Intuitively, when the standard deviation, \( \sigma \), of the distribution is comparatively low we would expect the pulses to be almost periodic. So the spectral density would be almost the same as for the exactly periodic pulses. This implies that in our case most of the signal power would be concentrated at the harmonic frequencies close to \( \frac{k}{\mu} \) (where \( \mu \) is the mean inter-event time, \( k \) is a positive integer).
When the distribution parameter \( \mu \) gets small, and \( \sigma \) is comparatively large, normal approximation of the truncated normal distribution will no longer work, and effective value of \( \mu_\text{eff} \) (the one measured during the experiment) will become notably different from the model parameter \( \mu \). Spikes in the spectral density might be observed close to \( \frac{1}{\mu_\text{eff}} \), but this is unlikely, because with comparatively larger values of \( \sigma \) the power will leak to nearby frequencies. Namely, the spikes will become harder and harder to notice, until they will mesh with the other spikes.
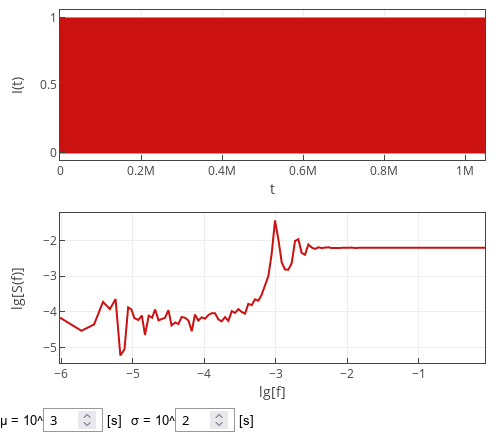
In the figure below we have comparatively low \( \sigma \), but not as low as to not see the spikes spreading out. If the value \( \sigma \) would be come at least as big as \( \mu \), then the spikes would disappear. On the other hand if \( \sigma \) becomes smaller, more spikes would become noticeable.
 Fig. 1:The spectral density of a point process with normally distributed inter-event times.
Notably, even if the extremely low values of \( \sigma \), the spikes closer to sampling frequency would still be indistinguishable due to discrete measurements and our chosen visualization algorithm.
Interactive app
Interactive app below samples time series from the point process with inter-event times being sampled from the truncated normal distribution. To verify the analytical intuitions above, we perform spectral analysis on the discretized time series. The discretized time series are obtained by counting the number of events inside unit time windows (the top plot). In total \( 2^{20} \) (roughly one million) such time windows are observed each time "Generate" button is pressed. PSD of the sampled series is shown in the bottom plot as a red curve.
