Heterogeneous detrapping process
Earlier, we have explored how power-law distributed detrapping times lead to 1/f noise. Moreover, we have also established that power-law distribution can be obtained from the superposition of exponential distributions (see this post). Now, what implications does the synthesis of these findings hold?
Hooge's parameter
As discussed in [1], such construction of the detrapping process enables the derivation of a readily interpretable expression for the Hooge's parameter:
\begin{equation} \alpha_H = \frac{\langle \tau_{\text{min}} \rangle}{\langle \theta \rangle}. \end{equation}
The provided expression suggests that Hooge's parameter depends on both the expected detrapping time from the shallowest trapping center, \( \langle \tau_\text{min} \rangle \) and the material's purity, represented by the average free-flight time, \( \langle \theta \rangle \). Hooge's parameter is important in characterizing the noise behavior in semiconductor devices, serving as a key metric in evaluating their reliability and performance.
Spurious low-frequency cutoff
Moreover, such formulation predicts the presence of a low-frequency cutoff in finite experiments. This cutoff can be mitigated by averaging data over multiple experiments or observing a large number of charge carriers. The phenomenon arises from the fact that the low-frequency cutoff is related to the smallest actually observed detrapping rate during the experiment. Even if the model parameter \( \gamma_\text{min} \) is set to zero, in practical scenarios, the effective \( \gamma_\text{min} \) will never reach zero. Furthermore, the cutoff frequency will always be higher than the lowest observable frequency.
Our calculation predict that the cutoff frequency [1]:
\begin{equation} f_c \approx \gamma_\text{min}^{(\text{eff})} \approx \frac{R + \gamma_\text{max} \langle\theta\rangle}{R T} . \end{equation}
In the above \( R \) stands for the number of single charge carrier experiments. It can be also replaced by \( N \) the number of charge carriers within a single experiment. Given that \( N \gg \gamma_\text{max} \langle\theta\rangle \), no low-frequency cutoff will be noticeable, as then \( f_c < 2/T \). Although, \( f_c > 1/T \) will be true for any duration \( T \).
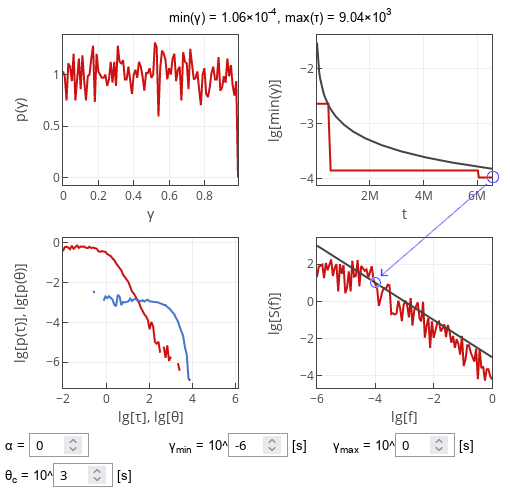
 Fig. 1:Sample simulation results showcasing spurious low-frequency cutoff. The arrow indicates that the low-frequency cutoff is related to the smallest detrapping rate actually observed during the experiment.
Interactive app
The interactive app below allows you to explore heterogeneous detrapping process. It plot for distinct plots: (top left) distribution of detrapping rates \( \gamma \), (top right) temporal dependence of smallest \( \gamma \) observed during the current run, (bottom left) distributions of detrapping and trapping times, and (bottom right) power spectral density of the signal. Observe that low-frequency cutoff is related to the smallest \( \gamma \) observed (i.e., compare rightmost plots).
Observe that, while the theoretical curve predicts (black curve in top right figure) a continuous gradual decrease of the smallest \( \gamma \) observed, but the experimental smallest \( \gamma \) observed decreases in steps. This is because theoretical curve predicts expected value of smallest \( \gamma \) observed.
Note: The app was includes an additional parameter \( N_{success} \). It will be discussed in a forthcoming post (the link will be added after that post is published). When exploring the app in the context of this post simply keep the default \( N_{success} = 1 \).
References
- A. Kononovicius, B. Kaulakys. 1/f noise in semiconductors arising from the heterogeneous detrapping process of individual charge carriers. Journal of Statistical Mechanics 2024: 113201 (2024). doi: 10.1088/1742-5468/ad890b. arXiv:2306.07009 [math.PR].
