Schelling's segregation model
Around 1970 American economist Tom Schelling published couple well cited articles in which he tried to explain racial segregation observed in larger cities in US [1]. He tried to comprehend how and why racial neighborhoods were forming and becoming so prominent. He wanted to know if ubiquitous racial segregation is caused by rising racial tensions or the same result might be present in a rather tolerant society.
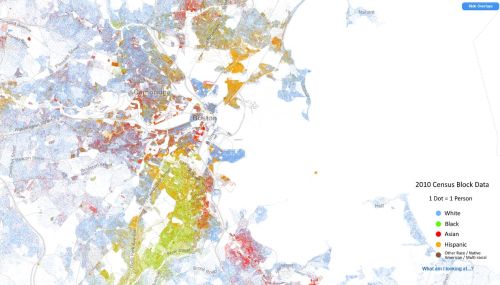
 Fig. 1:Racial segregation in Boston and around it. Data can be found on http://demographics.coopercenter.org/DotMap/index.html.
Agent model
Schelling proposed a simple agent-based model to answer this question. In his model agents are constantly looking for a good place to live on grid. Initial grid is populated randomly with different types of agents as well as some cells being left empty. Then random agents check if they like their neighborhood or not. Agents like their neighborhood based on the similarity of types of their neighbors. If they do not like it, they try to move to other empty cells.
Below you will find a HTML5 app in which agents may be of two types - reds and blues. Initially, while populating the grid with agents, two parameters are important - probability that cell might be empty, \( p_e \), and probability that non-empty cell contains red agent, \( p_r \). After going through all cells and forming initial configuration, random agents are picked one at a time. The agent counts number of his nearest neighbors of the same type, \( N^{(i,j)}_s \) (here \( (i,j) \) is cell coordinate), and also a number of nearest neighbors of the different type, \( N^{(i,j)}_o \). If \( \frac{N^{(i,j)}_s}{N^{(i,j)}_s + N^{(i,j)}_o} \geq h \) (here \( h \) is a model parameter) holds, then agent is happy with his current neighborhood and he remains at his current location. Otherwise agent moves to a random empty cell.
Interactive HTML5 app
Use the below app to see how the model results change when more/less space becomes available (increase/decrease \( p_e \)), when society is more/less heterogeneous (deviations from \( p_r = 0.5 \)) or when society is more/less tolerant (decrease/increase \( h \)). On the left side you can always see how current grid state looks like. On the right you can see a plot with fraction of happy agents (number of happy agents divided by total number of agents) and mean segregation (mean value of \( \frac{N^{(i,j)}_s}{N^{(i,j)}_s +N^{(i,j)}_o} \) over all agents).
Note that mean segregation is always larger than \( h \). Thus agents are not as intolerant as collective dynamics would suggest.
References
- T. Schelling. Some Fun, Thirty-Five Years Ago. In: Handbook of Computational Economics, vol. 2: 1639-1644. Elsevier, 2006.
