Z. Griffiths: The Greedy Billionaire paradox
Can you increase wages without increasing spending? Yes, you can. More details and important implications outside just the field of economics in the video by Zoe Griffiths.
Can you increase wages without increasing spending? Yes, you can. More details and important implications outside just the field of economics in the video by Zoe Griffiths.
Suppose you have obtained a sample path of Brownian motion using discrete step size \( \Delta t \). Yet what happens at a finer scale? While in the experimental setup it would be impossible to say how the Brownian particle actually moved in between \( t \) and \( t + \Delta t \), one could numerically generate probable paths particle took in that time period. We do this by relying on the fractal nature of the Brownian motion.
We have started the year by finishing the series of posts on the anomalous diffusion in voter model. The series featured one more recent endeavor with Rytis Kazakevičius and one "forgotten" paper written for my postdoctoral project. We also went back to the topic of the opinion dynamics and have talked about supportive interactions and partisan voting. We have finished the year by exploring various time series models leading us up to ARFIMA model.
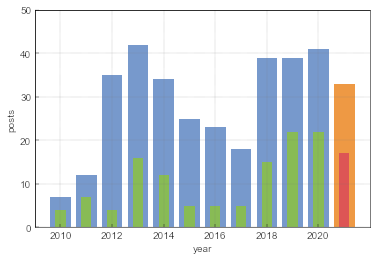
All in all, Physics Risk had 33 posts in 2021 (-8 posts in comparison to 2021). 17 of the posts were filled under interactive models tag.
 Fig. 1:The number of posts written in English and still available on this iteration of Physics of Risk. The wide bars represent total number of posts for each year since 2010, while the narrower bars represent a number of posts with 'Interactive models' tag.
I guess my tempo is dropping a bit as I am running out of easy to make and interesting enough material. Some of the things I am doing now are not easy to implement in JavaScript (even in C/Python I have to rely on 3rd-party libraries to do the heavy-lifting stuff) and to show off to the broader public in the usual Physics of Risk style. And while there are interesting things I could still show you, most of them are not of the immediate interest to me, so it is hard to find strength and time to continue. I guess a new style will need to be invented.
The last post in the ARFIMA series was not the last stop in understanding the model we have studied in [1]. In the paper we have looked at ARFIMA as a model for fractional Levy stable motion (abbr. FLSM), which is a generalization of Brownian motion in two regards: fractionality and noise distribution.
In this Numberphile video Matt Henderson talks about creating animations illustrating chaos theory. In fact it is somewhat surprising that apparently simple linear system (bouncing ball) exhibits chaotic behavior. How? Watch the video below and find out.