The phenomenon of economic growth of Baltic states
The quantitative comparison of economic growth of various states is still an ambiguous task. Economists and statisticians use various estimates of Gross Domestic Product (GDP) taking into account inflation, population, exchange rates etc. Here we present a graphical comparison of GDP growth of various states aimed at the estimation of relative input of various states into regions or the world economy and at the measure of economic convergence. We choose the estimate of GDP in common currency US dollars calculated in current prices and current exchange rates. In order to compare different size states we use GDP normalized per capita. Such data is available at the World Bank Database.
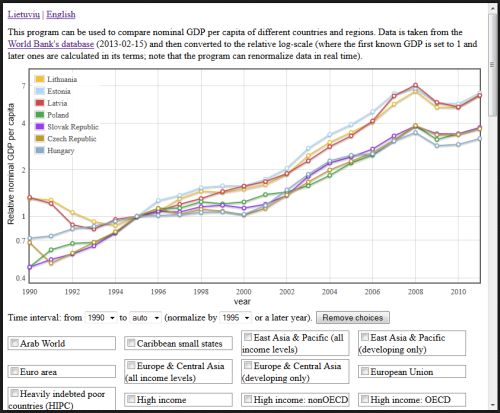
We do plot the ratios of GDP per capita in US dollars with GDP of the same state in the selected reference year. The interactive plot gives you an opportunity to choose states, reference year and the time interval of series. You will see how these plots reveal the most general regional and geopolitical features of economic convergence. You will observe the incredible coincidence of GDP series for some selected states. From our point of view, this is a challenge for macroeconomics theory as observed universality has to be explained. It means that the external economic environment and stage of states development maters more than specific regulation inside the state. Three Baltic states: Lithuania, Latvia and Estonia serve as a good example of such universality, despite considerable differences in their regulation within states. Similar comparison is appropriate for the Visegrad Group: Poland, Czech Republic, Slovak and Hungary. The Joint graphic of all these 7 states is given in Figure or you can open the interactive graph in the new Tab clicking on Baltic and Visegrad GDP. It is worth to note that the relative growth rate of Baltic states is considerably higher than growth of Visegrad Group in the period 1995 - 2011. This exhibits a more rapid convergence of Baltic states into European economic space.
 Fig. 1:The ratio of GDP in US dollars per capita in 1990-2011 to the GDP in reference year 1995 for Baltic and Visegrad states.
We do consider the universal behavior of new EU economies as a challenging macroeconomic phenomenon, which deserve a scientific reasoning and quantitative description. Comprehensive macroeconomic description of this phenomenon should contribute to the explanation of economic convergence. From our point of view, the main concepts of such consideration could be based on the methods of statistical physics, Levelling of prices through the real appreciation of currencies of developing states, Balassa-Samuelson effect and other models of international trade and investment.
Interactive program
Note: The app was updated with most recent available data on 2018-02-11.
