V. Gontis: Lithuania's Economic Growth — Exceptional in Central and Eastern Europe
Comparing the economic development of countries is not as straightforward as it may seem to many. The most commonly used indicator—Gross Domestic Product (GDP) per capita or per employee—can vary significantly depending on the currency used and how inflation in goods, services, and money is accounted for. What complicates comparison most is that exchange rates between currencies do not reflect differences in purchasing power across the countries being compared.
To address this issue, the Purchasing Power Parity (PPP) method has been developed, which introduces a real exchange rate that accounts for price level differences between countries. As a result, economic statistics experts around the world generally agree that international comparisons of economic development must be based on the PPP method.
However, we must acknowledge that in the public domain—including even in widely recognized sources of economic information—other comparison methods are often used. Most commonly, we see countries compared by real GDP, adjusted to constant prices and expressed in a common currency. It should come as no surprise that such comparisons often yield very different results than those based on PPP.
In this brief overview of economic development in Central and Eastern Europe (CEE), we rely on data from the International Monetary Fund (IMF) World Economic Outlook (WEO) database, using the PPP method. The selected period spans 1995 to 2030, for which this data is available. Understandably, figures from 2025 to 2030 are projections, but they are based on the best available macroeconomic models and the observed development of each country up to 2024.
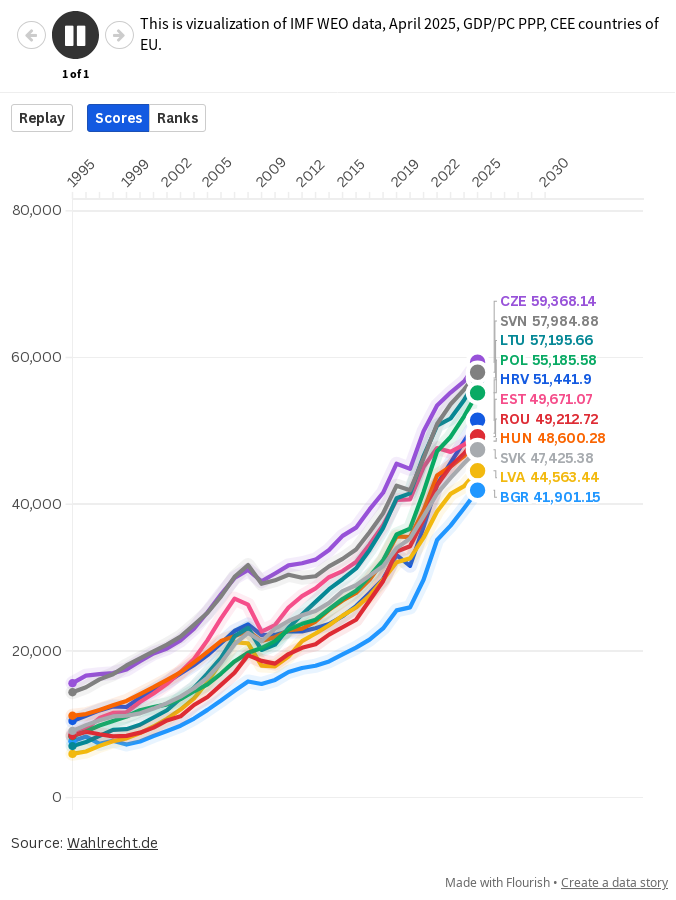
Below, an interactive country comparison chart (hosted on Flourish) presents both the absolute values of GDP per capita in international US dollars (click "Scores") and the ranking of each country relative to others (click "Rank").
Both visualizations are highly valuable.
- The "Scores" view gives a compelling sense of how successfully CEE countries have integrated into the Western economic space: GDP growth reaches up to tenfold.
- There is no doubt that the new EU member states are rapidly converging with the old ones, confirming the economic success and benefits of the EU project for CEE countries.
Country-by-country comparison becomes even more dynamic when shown by ranking in the "Rank" view. In this visualization, Lithuania advances from the second-lowest position in 1995 to a projected leadership role by 2030. Had we included Southern European countries such as Italy, Spain, Portugal, and Greece, it would become clear that Lithuania is expected to lead even among them.
Although Lithuania still faces many unresolved social challenges, it can rely on a strong economic foundation as it seeks the best available ways to overcome them.
Note: This text was originally published on gontis.eu. Some changes may have been made to make the text fit Physics of Risk content presentation style.

